Understanding Market Size and Why It Matters

Market size is one of the most important concepts in business planning and market research—but also one of the most misunderstood. While the term appears frequently in pitch decks, strategy documents, and marketing plans, many brands either miscalculate it or rely on untested assumptions.

So, what is market size really? At its core, market size refers to the total number of potential buyers for your product or service, and the total possible revenue those buyers could generate. Understanding your market size provides a much-needed reality check. It helps you assess the true scale of the opportunity, determine whether your idea is commercially viable, and make informed decisions around product development, pricing strategy, and market positioning.

Getting it right can unlock better investment, sharper strategy, and a faster path to market success. Getting it wrong can mean wasting time, money, and resources on a market that’s too small, overly saturated, or fundamentally misaligned with your offer.

In this article, we break down how to calculate market size and why accurate market sizing should be at the heart of any business strategy. We also explore the difference between total, serviceable, and obtainable markets—and how to use these metrics to build realistic growth plans. If you’re looking for a deeper dive into advanced modeling, see our global market sizing guide.

How to Describe Market Size in Business Terms

In business, market size is typically expressed as the total addressable market (TAM). This includes all potential buyers within a defined market over a defined period—usually one year. Market size can be measured in:

  • Volume: the total number of potential customers or units sold
  • Value: the total potential revenue based on average price and purchase frequency
  • Buying frequency: how often a typical customer purchases per year

Describing market size this way gives businesses a clear, quantifiable view of the opportunity ahead. It enables better resource allocation, sharper targeting, and more credible investor pitches. For a more specific framework, you can read our guide on the top-down market sizing approach.

What Does Market Size Really Measure?

Market size isn’t just a number—it’s a commercial forecast. It answers the question: If there were no barriers to entry, how much revenue could we generate in this space?

Some sources define market size purely as the number of buyers, but this is limiting. A meaningful market sizing analysis also considers price points, consumption rates, geographic constraints, and channel access. It’s less about how many people exist in a segment and more about what they’re willing to spend, and how frequently.

That’s why market sizing forms the foundation of many business decisions, including product launches, geographic expansion, and investor funding rounds.

Why Accurate Market Sizing Drives Better Business Decisions

Understanding why market size is important goes beyond the pitch. It touches every part of strategic planning and operational execution. Here’s how:

Secure investment with confidence
Investors back scalable opportunities. Demonstrating a clearly defined market—sized with evidence—shows your business has growth potential. It turns your pitch into a business case.

Build stronger go-to-market strategies
Knowing how big your market is helps determine which customer segments to prioritize, which pricing models are feasible, and how aggressive your growth plan can be.

Align hiring and operations to growth
Whether you’re in startup mode or scaling a mature business, knowing your market size helps you plan the right team structure, hiring roadmap, and operational budget.

Avoid wasted spending
Too often, R&D and marketing budgets are blown chasing markets that can’t deliver ROI. Market sizing lets you focus spend on opportunities that are large enough—and realistic.

Stay out of saturated or unviable markets
Accurate market sizing forces a sober look at whether there’s a real, addressable demand for your offer. It’s the first filter before pouring money into a launch.

For a related analysis, see our guide to calculating market potential, which explains how to validate demand and ensure your assumptions hold up.

Stay ahead

Get regular insights

Keep up to date with the latest insights from our research as well as all our company news in our free monthly newsletter.

How to Calculate Market Size Step by Step

There’s no universal method for calculating market size, but a structured, evidence-based process gives you a more accurate and defensible estimate. Whether you’re launching a product, entering a new region, or pitching to investors, knowing how to calculate market size is a critical early step. Here’s how to do it effectively.

Step 1: Define Your Target Market

Start by defining who your product or service is for. Avoid overestimating by being specific. Segment your audience by:

  • Demographics (age, income, gender)
  • Geography (region, city, country)
  • Firmographics (company size, industry—for B2B)
  • Behavior (usage patterns, purchase habits)

Clarity here avoids inflating your market size with irrelevant segments.

Step 2: Estimate the Total Number of Potential Customers

Use trusted secondary data sources like:

  • National census data
  • Government statistics offices
  • Industry reports such as Statista or IBISWorld
  • Trade associations
  • Google Trends

This step helps calculate how many individuals or organisations fall within your defined target market. That total becomes your potential buyer base.

Step 3: Understand Buying Frequency

Determine how often the average customer will make a purchase in a year. Is your product a one-time buy, a quarterly subscription, or something customers reorder frequently? This figure affects your total revenue projection and your customer lifetime value model.

Step 4: Determine Average Transaction Value

Estimate the price of your offering, or use market benchmarks. Depending on your business, you might choose to calculate:

  • Average order value (AOV)
  • Average annual revenue per customer
  • Contract size or subscription fee

Understanding pricing helps translate demand into financial terms.

Step 5: Use the Basic Market Size Formula

This gives you your Total Addressable Market (TAM) in terms of annual revenue.

Example:
If your audience is 100,000 people, your product sells for £25, and they purchase four times a year, your market size is:

100,000 × £25 × 4 = £10,000,000 annually

Step 6: Validate Your Assumptions with Market Research

No model is complete without validation. Your inputs are only as good as your research. Use qualitative and quantitative methods—like surveys, in-depth interviews, and concept testing—to ensure the demand you’re projecting reflects reality.

For more complex international projects, see our global market sizing techniques to account for regional differences.

Is Your Market Size Big Enough?

Once you’ve calculated your total market size, you need to assess whether it’s large enough to support your business model and growth targets.

Here are some general benchmarks:

  • Venture-backed startups often seek markets over £800 million
  • Bootstrapped or niche businesses can thrive in smaller markets (e.g., £10–£100 million), especially with high-margin or repeat-purchase models

If your market size seems too small, revisit your pricing strategy or segmentation. Sometimes the real value lies in serving a more targeted segment exceptionally well. the only number that matters. Investors and stakeholders will also want to know how much of that market you can realistically serve, which brings us to the next metric.

From Market Size to SOM: What Can You Actually Reach?

Calculating market size shows the full opportunity—but that doesn’t mean you’ll capture it all. That’s where Serviceable Obtainable Market (SOM) comes in.

Your SOM represents the realistic portion of your market size that your brand can reach, serve, and convert given current capabilities. It reflects your distribution, marketing budget, operational footprint, and market competition.

Key factors that reduce your SOM:

  • Limited marketing or sales reach
  • Competitive saturation
  • Regulatory constraints
  • Budget for customer acquisition
  • Distribution and fulfilment channels

For context, explore our article on calculating market share to see how SOM fits into the bigger picture.

How to Calculate the Serviceable Obtainable Market (SOM)

Once you’ve defined your market size, the next step is narrowing down to SOM. Here are the three best approaches to estimate SOM—ideally used in combination.

1. Top-Down SOM Estimation

This method begins with a published industry-wide market figure (such as from Gartner, IBISWorld, or Statista) and applies a series of logical filters.

Example:

  • Total global market: £2 billion
  • Your target geography: 10% = £200 million
  • Your segment: 25% = £50 million
  • Projected share: 10% = £5 million

While this gives a broad sense of potential, its accuracy depends on realistic assumptions. Learn more in our top-down market sizing guide.

2. Bottom-Up SOM Estimation

This method builds from your internal data—marketing capacity, distribution coverage, and pricing.

If you can realistically reach 10,000 customers and each brings £200 per year, your SOM is £2 million. This method is more grounded in your actual capabilities and is preferred by investors for early-stage ventures.

3. Value Theory SOM Estimation

This approach estimates SOM based on perceived value and willingness to pay.

Example:
If your SaaS tool replaces a £250/month manual process, and customers value it at £180/month, multiply that by the number of prospects who would adopt it based on this value proposition.

Use this method when pricing is premium or when positioning is disruptive and not easily benchmarked.

Blend SOM Methods for More Accuracy

Each method offers strengths:

  • Top-down provides scale
  • Bottom-up gives credibility
  • Value theory captures pricing power

The best estimates triangulate all three—presenting a credible, growth-aligned figure. For deeper insight, refer to our guide to calculating market potential and learn how layered estimates lead to better forecasting.

SOM Is Not the End Goal—But It’s a Vital Step

Calculating your market size and narrowing it down to your Serviceable Obtainable Market (SOM) is a critical early step in building a successful business. These figures help you gauge commercial potential and determine where to focus your efforts—but they are not the final objective.

Market size tells you the scale of the opportunity. SOM shows what portion of that you can realistically capture. What truly matters is how you act on these insights. Without a clear strategy to convert opportunity into revenue, even the best estimates remain theoretical.

This is where high-quality market research makes the difference. At Kadence, we help brands move beyond assumptions with robust qualitative and quantitative research methods. From testing demand to refining positioning, our insights turn static models into strategic action.

If you’re preparing to launch a new product, expand into another region, or secure funding, accurate market size and SOM calculations are just the beginning. We’ll help you take the next step with confidence.

Submit a brief and we’ll show you how we can support your team with research that gives you confidence in every decision.

Frequently Asked Questions about Market Size

What is meant by market size?
Market size refers to the total potential demand for a product or service in a given market. It represents how many people or businesses could buy from you, and how much revenue they might generate.

How do you calculate market size?
Market size is calculated by multiplying the number of potential customers by the average transaction value and purchase frequency. This can be approached using top-down or bottom-up methods depending on data availability.

What is size market size?
This is a typo often seen in searches. The intended question is usually “What is market size?”—it means the estimated value or volume of a defined market over a specific period.

How do you describe the size of the market?
You describe it in terms of either value (total sales revenue potential) or volume (number of potential customers or units sold annually). Including both figures provides a comprehensive view.

Understanding the size of your target market can be the difference between launching a wildly successful product and sinking resources into an untapped and unprofitable niche. 

Accurate market size calculation is crucial to business success. It helps senior leaders navigate complex market landscapes and make informed strategic decisions. Understanding your market’s true potential is critical whether you’re planning to enter a new market or launch a product. Companies risk overestimating opportunities without precise data, leading to misallocated resources and potential failure.

Market size calculations grounded in thorough research offer brands a strategic advantage. By analyzing consumer demand, competitive landscapes, and market trends, brands can identify untapped opportunities and avoid costly missteps. This data-driven approach is especially important in international market expansion, where cultural nuances, economic conditions, and purchasing behaviours vary significantly across regions.

To stay competitive, senior leaders must leverage AI-driven predictive models, real-time data collection, and scenario analysis. These advanced tools provide a clearer, more dynamic view of market potential, allowing brands to adapt to changes in consumer behaviour, economic conditions, and competitive landscapes.

What is Market Size?

Market-sizing

Market size represents a business’s total revenue or sales volume within a specific market. It encompasses two primary components:

  • Total Addressable Market (TAM): The total demand for your product or service.
  • Serviceable Available Market (SAM): The portion of the TAM that is realistically targetable given your resources, competition, and market position.

While TAM offers a macro-level overview, SAM provides actionable insight, allowing you to focus on the areas with the highest growth potential.

Why Market Size Matters for Businesses

Understanding market size is essential for companies because it helps set realistic goals and growth strategies. 

Whether launching a new product or entering a new market, knowing the potential market size can inform decisions about product development, marketing efforts, and resource allocation. 

For example:

  • Product Launches: Calculating market size helps companies assess whether there’s enough demand to justify investing in product development. It allows brands to target segments with high growth potential, avoiding wasted efforts on oversaturated or declining markets.
  • Market Entry Strategies: For companies looking to expand into new regions, understanding the size of the potential market helps identify opportunities. It also helps tailor entry strategies based on local consumer behaviours, economic conditions, and competitive landscapes.
  • Resource Allocation: A clear understanding of market size allows companies to allocate budgets, staffing, and marketing resources more effectively. It ensures investments are directed toward the most promising opportunities, improving ROI and minimising risks.

Hypothetical Example: The EV Market in the Philippines

To illustrate the process, consider a hypothetical scenario in which a major global automotive brand is contemplating entering the electric vehicle market in the Philippines. The company begins by calculating the market size and analyzing the country’s growing middle-class population, increasing urbanisation, and government incentives for green technology. Based on these factors, they estimate the total addressable market (TAM) and the serviceable available market (SAM) for EVs.

The insights from this research allow the company to focus its entry strategy on urban areas with the highest potential for EV adoption. By strategically allocating resources toward infrastructure partnerships for charging stations, the brand positions itself as a leader in sustainable transportation within the Philippines.

This example demonstrates how understanding market size gives brands the insights to make informed decisions, driving success in product launches and market expansions.

Key Approaches to Calculating Market Size

Calculating market size effectively requires a combination of traditional methodologies and AI-driven models for dynamic predictions. Here are the key approaches and their application in today’s fast-changing global markets:

Top-Down Approach for Market Sizing

The top-down approach starts with broad industry data, such as government reports, and narrows it down to your target market. While useful for estimating large markets, it can often overlook local nuances and consumer behaviour specifics.

AI Forecasting Models:
Modern AI tools enhance the top-down approach by using predictive analytics to project future demand. These models analyze vast data sets, including historical market data, competitor trends, and consumer sentiment, to provide more accurate predictions.

Example Scenario:
The global automaker in our previous example entering the EV market in the Philippines could start by analyzing the $500 billion global EV market. By using AI models, they can refine their estimate to account for specific factors like EV infrastructure readiness, consumer preferences, and government incentives. This dynamic model would forecast how the market might grow over time, offering more precise insights than static industry reports.

Bottom-Up Approach to Determine Market Size

The bottom-up approach is more granular, focusing on data from local surveys, sales figures, and consumer interviews. It provides precise, actionable insights by starting at the ground level and scaling upwards.

Predictive Analytics for Consumer Behavior:
Predictive analytics, driven by machine learning, can analyze customer behaviour patterns from past transactions, providing dynamic insights into future purchasing trends. This allows brands to scale their bottom-up analysis beyond traditional surveys.

Example Scenario:
For a company entering the plant-based food market in Japan, real-time consumer surveys combined with AI-based behaviour analysis could reveal current consumption trends and predict shifts in preferences, such as increasing demand for eco-friendly or organic products. This insight allows for more accurate scaling of market size and better-informed product development.

Hybrid Approach to Market Sizing

The hybrid approach integrates top-down and bottom-up methods, offering a comprehensive view by blending industry-wide data with detailed local insights.

Scenario Analysis:
Scenario analysis allows companies to project different future outcomes based on various market conditions, such as economic downturns or sudden shifts in consumer behavior. This approach helps companies develop a range of potential market sizes, reducing reliance on a single estimate and improving strategic flexibility.

Example Scenario:
A beauty brand entering China’s cruelty-free market might use top-down reports estimating the total beauty market at $60 billion and supplement this with consumer surveys. Through scenario analysis, the brand could model how different factors, such as regulatory changes or social movements, might affect demand for cruelty-free products, resulting in a more adaptive market strategy.

Steps to Calculate Potential Market Size

Accurately calculating market size requires data, advanced tools, and strategic foresight. 

Below are four advanced steps for senior leaders to ensure robust and actionable market size calculations:

  • Step 1: Define Your Target Market with AI and Predictive Modeling

Identifying your target audience is essential, but doing it with predictive modelling enhances precision. Machine learning algorithms can segment your audience based on historical data, real-time transactions, and behavioural cues, helping you identify the highest-value customers.


For instance, in Japan, using AI to analyze the purchasing patterns of senior grocery buyers could reveal untapped market segments or emerging preferences, such as increased demand for organic products among older consumers.

  • Step 2: Analyze Market Demand Using Real-Time Data

Relying on static data is risky for brands. Analyzing real-time data—such as digital transaction flows, social media activity, or mobile app usage—offers a dynamic view of market demand.

Example Scenario:
In Vietnam’s fast-fashion market, brands could use social listening tools and real-time purchase data from e-commerce platforms to predict upcoming fashion trends. By analyzing how consumers interact with fast-fashion brands online, the company could refine its market demand estimates and optimise its product range accordingly.

  • Step 3: Identify Competitors and Leverage Competitive Intelligence

Understanding the competitive landscape goes beyond identifying your competitors. It involves leveraging competitive intelligence tools that track pricing strategies, product launches, and consumer loyalty in real time.

AI-Powered Competitor Analysis:
AI tools can continuously monitor competitors’ activities, providing alerts on market shifts, new product launches, or changes in pricing strategies. This allows companies to stay agile and adjust their market size calculations accordingly.

Example Scenario:
In Singapore’s online gaming sector, AI-powered competitor intelligence can track shifts in consumer preferences across platforms, allowing a new entrant to identify untapped niches within a highly saturated market.

  • Step 4: Estimate Market Value with Dynamic Forecasting Models

Traditional market value estimation methods involve static calculations of potential revenue. Today, dynamic forecasting models allow brands to estimate revenue based on real-time data streams and projected market conditions.

Example Scenario:
In India’s digital payment space, AI-driven models could analyze user transaction patterns, banking access, and digital literacy trends to offer projections that reflect current and future market opportunities. This allows companies to scale more effectively, planning for changes in consumer adoption rates or regulatory policies.

Common Challenges in Calculating Market Size (and How to Overcome Them)

Senior leaders and market researchers face several challenges when calculating market size, but these obstacles can be mitigated using advanced tools and strategies:

  • Data Limitations: Use AI and machine learning to fill gaps, generate forecasts, and continuously refine your data sets with real-time information.
  • Rapidly Changing Conditions: Invest in scenario analysis to account for multiple possible futures, preparing for changes in demand or economic conditions.
  • Regional Differences: Use localised AI-driven models to account for cultural, regulatory, and economic variations across regions.
  • Overestimating TAM: Use AI to break down TAM into more realistic segments and predict which parts of the market are truly serviceable and attainable.
dining-personas

Actionable Recommendations for Market Leaders

Accurately calculating market size is not a one-time task; it is a dynamic and ongoing process that demands a combination of data-driven insights, predictive analytics, and strategic foresight. 

For senior leaders—brand managers, product managers, researchers and CMOs—leveraging the right approaches unlock growth opportunities and helps navigate complex market conditions. 

Here are key takeaways from our global research projects for strategic decision-making:

  • Leverage AI and Predictive Analytics

AI-driven tools should be integrated into your market research strategy to analyze data dynamically, predict trends, and continuously adjust market size calculations. Machine learning algorithms can track consumer behaviour in real-time, allowing for precise market size predictions, especially in rapidly changing industries like tech and healthcare.

Tip: Use AI to enhance traditional market size calculations by incorporating real-time data, predictive analytics, and automated updates. This allows for a more dynamic and accurate understanding of market potential. For example, predictive models can forecast how emerging technologies may impact digital payments or consumer behaviour shifts in fast-fashion markets.

  • Apply Tailored Strategies for Specific Industries and Regions

Market size calculations should be tailored to the industry and region’s unique characteristics. Each sector—whether technology, healthcare, or retail—has different market dynamics, while each region introduces variables such as cultural differences, economic conditions, and regulatory frameworks.

Tips for Tailoring Market Size Calculations:

  • Industry-Specific: In industries driven by innovation, such as automotive or tech, emerging trends and technological advancements are incorporated into market size calculations. In traditional sectors like retail, historical data and consumer behaviour patterns may provide more stable insights.
  • Regional Adaptation: For global companies, segment market analysis by region and factor in local consumer preferences, regulatory conditions, and cultural nuances. For example, a mobile-first strategy may be essential in the digital payments space in India, while sustainability and cruelty-free preferences may shape the beauty market in the UK.
  • Focus on Serviceable Market Segments for Realistic Growth

Overestimating the Total Addressable Market (TAM) often leads to inflated expectations. Senior leaders should instead focus on the Serviceable Available Market (SAM) and Serviceable Obtainable Market (SOM)—the realistic segments where your brand can effectively compete and capture market share.

Tips for Targeting Serviceable Markets:

  • Narrow Market Segments

Identify key market segments that align with your brand’s strengths and competitive advantage. Use detailed customer personas and AI-driven behavioural analytics to focus on high-potential groups.

  • Assess Market Entry Barriers

Consider competitive pressures, pricing, and regulatory hurdles to understand how much of the SAM is realistically achievable. For instance, new digital payment market entrants must analyze user adoption rates and infrastructure readiness to set realistic growth targets.

  • Adopt Scenario Analysis for Greater Flexibility
    Markets evolve rapidly, making it essential to develop agile, flexible strategies. Scenario analysis allows senior leaders to project multiple outcomes based on different market conditions—economic shifts, regulatory changes, or technological breakthroughs—providing a range of potential market sizes and reducing reliance on a single estimate.
    Tip: Model different market projections, such as how an economic downturn might affect consumer demand or how technological advancements could open new market opportunities. This flexibility allows leaders to adjust their strategies quickly in response to evolving market dynamics, staying resilient and competitive.
  • Leverage Continuous Market Research for Agile Decision-Making
    Relying on static, one-time market size estimates is insufficient in today’s fast-moving market environments. Continuous market research enables brands to stay agile, quickly respond to changing consumer behaviours, and seize new opportunities as they emerge.

Tips for Continuous Research:

  • Adopt Real-Time Data Tools

Implement tools for ongoing data collection and analysis, such as digital analytics platforms, AI-based social listening tools, and automated consumer surveys. These provide immediate insights into consumer trends as they develop.

  • Periodic Market Size Reviews

Regularly review and update your market size calculations to reflect current trends and external shifts. Dynamic forecasting models can help adjust strategies to respond to sudden market shifts, such as regulatory changes or competitive disruptions.

  • Collaborate Across Departments for a Holistic View
    Market size calculations should not be isolated within marketing or strategy departments. Instead, a cross-functional approach incorporating sales, finance, product development, and operations insights ensures a more comprehensive and actionable view of market potential.

Tips for Cross-Department Collaboration:

  • Engage Sales Teams

Sales teams directly contact customers and can provide valuable insights on demand patterns, emerging consumer needs, and market saturation. Their input ensures market size estimates reflect actual market conditions.

  • Collaborate with Finance

Align market size calculations with revenue forecasts. By collaborating with the finance team, brands can ensure growth targets are realistic, achievable, and backed by sound financial analysis.

  • Prioritise Data-Driven Decision-Making
    Data is the foundation of accurate market size calculations. Senior leaders should prioritise decisions based on robust data trends and predictive analytics rather than relying on intuition or anecdotal evidence. This approach minimises the risk of misallocating resources and allows brands to adjust their strategies as market conditions evolve.

Tips for Data-Driven Decision-Making:

  • Use Multiple Data Sources: Combine primary and secondary research, internal sales data, AI-based analytics, and third-party reports to build a holistic view of market potential.
  • Validate Assumptions Continuously: Regularly validate assumptions by cross-referencing updated industry reports, competitor analysis, and customer feedback. This ensures your market size estimate evolves alongside real-time data, allowing for more accurate and reliable forecasts.

Final Thoughts

Calculating market size is no longer a one-time exercise but a continuous process enhanced by AI-driven tools, predictive models, and real-time data. By leveraging advanced analytics, senior leaders can make more informed decisions, adapt to market shifts, and drive sustainable growth. With the right strategies in place, brands can confidently navigate uncertainty and capitalise on the full potential of their target markets.

Now is the time to invest in the market research services, tools and insights needed to refine your market size calculations and stay competitive globally.

In the bustling business landscape, a vital metric emerges as a beacon of success: market share. It is a measure that holds the power to shape strategies, unlock opportunities, and gauge a company’s competitive prowess. Yet, understanding the intricacies of market share and effectively harnessing its potential remains a challenge for many.

Picture a vibrant marketplace teeming with customers and competitors. Within this dynamic landscape, market share is a vital yardstick that illuminates performance and offers insights into market dynamics. It is more than a mere number on financial reports; it reflects a company’s dominance and influence in the market.

Calculating market share is not merely an exercise in number crunching; it holds many benefits for marketers. Through market share analysis, we can uncover hidden opportunities, evaluate brand performance, and gain valuable insights into competitive positioning. It is a powerful tool that enables informed decision-making and paves the way for effective strategies.

But what exactly is market share, and why should we invest our time and efforts in calculating it? 

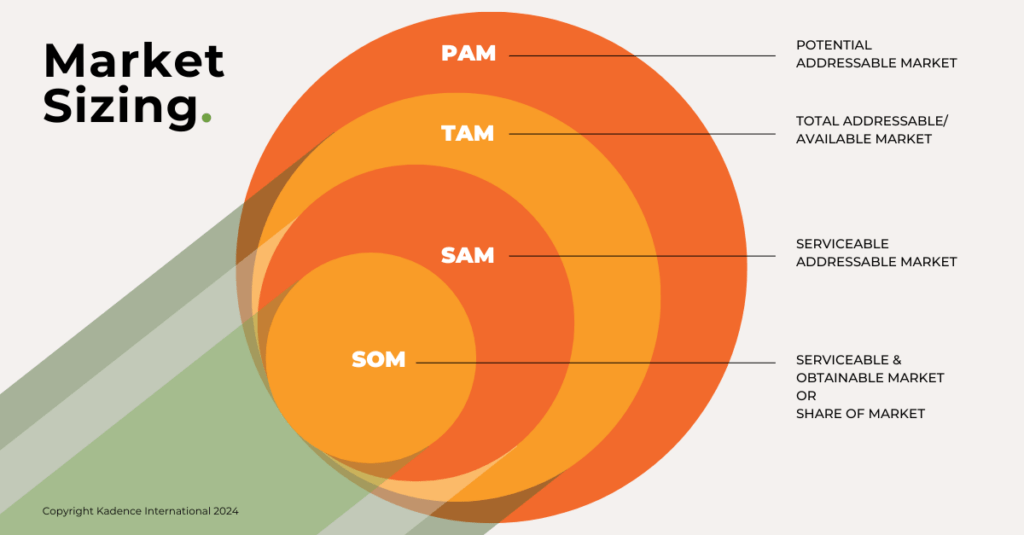
In this guide, we will dissect the different types of market share, ranging from the overall market share that encompasses an entire industry to the segment-specific market share that reveals performance within targeted market segments. 

From unit-based and revenue-based calculations to customer-based approaches, we will equip you with the knowledge and practical examples to master the art of market share calculation.

We will delve into the data sources required for market share calculation, such as market research reports, sales data, customer surveys, and industry insights. 

Whether you are a seasoned marketer or an aspiring entrepreneur, this comprehensive guide will empower you to navigate the complexities of market share analysis with confidence and clarity.

What is market share?

Market share refers to the portion or percentage of a specific market that a company or brand controls in terms of sales, revenue, or units sold. 

It measures a company’s relative position within the market compared to its competitors. Market share often indicates a company’s performance, market presence, and competitive strength. It provides insights into a company’s ability to attract and retain customers, market penetration, and overall market dominance within a specific industry or product category.

The phrase “market share” was first used in economics and business in the early 20th century. While it is difficult to attribute the exact origin of the term to a specific person, the concept of market share began to gain prominence in academic and business literature during the mid-20th century.

One notable economist who contributed to the development of market share analysis was Edward Chamberlin, an American economist who introduced the concept of monopolistic competition in his book “Theory of Monopolistic Competition,” published in 1933. Chamberlin’s work focused on market structures and the measurement of market power, which laid the foundation for understanding market share as an indicator of a firm’s position within a competitive market.

Since then, market share analysis has become a widely recognised and essential metric in business and marketing, employed by companies, researchers, and industry analysts to evaluate performance, make strategic decisions, and assess market dynamics.

Methods for Calculating Market Share

Now that we have grasped the importance of market share and its relevance in the business landscape let us delve into the various methods and formulas used to calculate this influential metric. By understanding these calculation approaches, we can gain a comprehensive view of our market position and make data-driven decisions to drive business growth.

Unit-Based Market Share: One commonly used method to calculate market share is the unit-based approach. This method involves comparing the number of units a company sells to the total number sold in the market. The formula for unit-based market share is:

Unit-Based Market Share = (Company’s Units Sold / Total Market Units Sold) x 100

For example, if a company sold 5,000 units of its product in a market where the total units sold were 20,000, the unit-based market share would be (5,000 / 20,000) x 100 = 25%.

beauty-trends

Revenue-Based Market Share: Another perspective in market share analysis is revenue-based market share. This method focuses on comparing the revenue generated by a company to the total market revenue. The formula for revenue-based market share is:

Revenue-Based Market Share = (Company’s Revenue / Total Market Revenue) x 100

For instance, if a company’s revenue were $1 million in a market with a total revenue of $5 million, the revenue-based market share would be ($1 million / $5 million) x 100 = 20%.

Customer-Based Market Share: Customer-based market share analysis provides insights into a company’s customer base compared to the overall market. This method considers the number of customers or a company’s share of customers. The formula for customer-based market share is:

Customer-Based Market Share = (Company’s Customers / Total Market Customers) x 100

For example, if a company has 500 customers in a market where the total number of customers is 2,500, the customer-based market share would be (500 / 2,500) x 100 = 20%.

It is essential to note that these calculation methods provide different perspectives on market share, and it is valuable to analyse them in conjunction to gain a holistic understanding of a company’s position in the market.

Gathering accurate and reliable data is crucial for precise market share calculations. Market research reports sales data, customer surveys, and industry data are key sources of information for collecting the necessary data. By ensuring data accuracy and reliability, we can enhance the credibility of our market share analysis and make more informed strategic decisions.

Gathering Market Data

Accurate and reliable data serves as the bedrock for calculating market share effectively. It is essential to gather data from diverse sources to obtain a comprehensive understanding of market dynamics and accurately assess a company’s performance. 

Market Research Reports: Market research reports offer invaluable insights into market trends, consumer behaviour, and competitor analysis. These reports, compiled by reputable research firms, provide a wealth of data on market size, growth rates, industry analysis, and customer preferences. Leveraging market research reports helps marketers gain a broader perspective and make informed decisions based on comprehensive and up-to-date information.

Sales Data: Internal sales data is valuable for calculating market share. It includes information on a company’s own sales figures, such as units sold, revenue generated, and customer segments. Sales data allows for a detailed analysis of a company’s performance and market share within specific product categories or geographical regions.

Customer Surveys: Conducting customer surveys can provide valuable insights into customer preferences, buying behaviours, and brand perceptions. By capturing customer feedback, we gain a deeper understanding of our target audience and how our brand stacks up against competitors. Customer survey data can help refine market segmentation strategies and identify growth opportunities.

Industry Data and Benchmarks: Industry data, such as trade association reports and government publications, can offer a broader perspective on market trends, regulatory factors, and industry benchmarks. Comparing a company’s performance to industry averages and benchmarks provides context and allows for a more accurate assessment of its market share. Industry data helps identify areas of strength and areas where improvement is needed.

Ensuring Data Accuracy and Reliability

While gathering data from various sources, it is crucial to prioritise data accuracy and reliability. Here are some key considerations:

Source Credibility: Ensure that the sources of data are reputable and trustworthy. Relying on well-established research firms, industry publications, and reliable data providers enhances the quality and reliability of the data.

Sample Representativeness: When using data from customer surveys or market research, it is essential to ensure that the sample represents the target market. A diverse and well-selected sample helps generalise the findings to the larger population.

Data Validation: Cross-checking data from multiple sources and validating the findings through triangulation can enhance data accuracy. By comparing data from different reports or conducting independent research, marketers can verify the consistency and reliability of the information.

Data Privacy and Compliance: Adhering to data privacy regulations and ethical considerations is essential when collecting and analysing data. Marketers should ensure compliance with applicable data protection laws and maintain the confidentiality and anonymity of respondents.

Calculating Overall Market Share

Calculating the overall market share is crucial in understanding a company’s position within its industry and evaluating its competitive standing. By determining the company’s share of the total market, we gain valuable insights into our brand’s performance and identify growth opportunities. 

Step 1: Define the Total Market Size 

To calculate overall market share, the first step is to define the total market size. This refers to the total sales, units, or revenue generated by all companies operating within the market during a specific period. Market research reports, and industry data sources can provide estimates of the total market size. We can put our performance into perspective by understanding the market’s scope and magnitude.

Step 2: Determine the Company’s Sales 

Next, gather data on your company’s sales within the defined market. This includes the total units sold or revenue generated by your company during the same period used to determine the total market size. This information can be obtained from internal sales records, financial statements, or sales reports. Accurate and up-to-date sales data is essential for precise market share calculations.

Step 3: Calculate Competitors’ Sales 

To calculate overall market share accurately, it is necessary to estimate the sales of competitors operating within the same market. This can be challenging, as competitors may keep their sales figures private. In such cases, market research reports, industry insights, and trade association data can provide approximate values or market share estimates for competitors. While these estimates may not be exact, they offer a reasonable basis for calculation.

Step 4: Apply the Market Share Formula 

With the total market size, company’s sales, and competitors’ sales in hand, you are ready to calculate the overall market share. The formula for calculating overall market share is as follows:

Overall Market Share = (Company’s Sales / Total Market Sales) x 100

For example, if your company’s sales amounted to $10 million and the total market sales were $100 million, the overall market share would be calculated as ($10 million / $100 million) x 100 = 10%.

Interpreting the calculated market share figure is equally important. A high market share indicates a stronger position in the market, whereas a lower market share suggests room for growth and increased competition. 

Comparing market share figures over time and against competitors can provide valuable insights into market trends and competitive dynamics.

By diligently calculating the overall market share, we understand our company’s market position and can leverage this information to drive strategic decision-making. However, calculating market share within specific market segments or product categories is equally crucial, providing a deeper understanding of performance in targeted areas. 

Calculating Segment-Specific Market Share

While understanding the overall market share is vital, assessing performance within specific market segments or product categories is equally important. Segment-specific market share analysis provides a deeper understanding of a company’s position and performance in targeted areas, allowing for more precise strategies and decision-making.

Step 1: Define the Market Segments 

To begin calculating segment-specific market share, defining the market segments or product categories relevant to your business is crucial. These segments can be based on factors such as demographics, geography, customer behaviour, or product attributes. By identifying and defining these segments, we can focus our analysis on specific areas of interest and tailor strategies accordingly.

Step 2: Determine Segment Sales 

Once the market segments are defined, gather data on the sales within each segment. This includes the company’s sales and the sales of competitors operating within each segment. The data can be obtained from sales records, market research reports, or industry databases. Accurate and granular data on segment sales is essential for precise segment-specific market share calculations.

Step 3: Calculate Segment Market Share

To calculate segment-specific market share, apply the following formula:

Segment Market Share = (Segment Sales / Total Segment Sales) x 100

For example, if your company’s sales within a specific segment amounted to $2 million, and the total segment sales were $10 million, the segment market share would be calculated as ($2 million / $10 million) x 100 = 20%.

Repeat this calculation for each segment of interest to derive the respective segment market shares.

Step 4: Analyse and Interpret Segment Market Share 

Interpreting segment market share figures provides valuable insights into the company’s competitive position within specific segments. A higher segment market share indicates a stronger presence and greater market penetration in that particular segment. Conversely, a lower segment market share may highlight opportunities for growth or areas where the company needs to strengthen its position.

Segment-specific market share analysis enables marketers to identify key growth areas, target specific customer segments, tailor marketing efforts, and allocate resources effectively. It helps understand customer preferences, evaluate product performance within different segments, and develop targeted strategies to gain a competitive advantage.

Moreover, segment-specific market share analysis provides a more nuanced view of the market, as it uncovers variations in customer behaviour and preferences across different segments. This understanding allows for more precise market positioning, product development, and customer engagement strategies, ultimately driving business growth.

We comprehensively understand our company’s performance within specific market segments or product categories by calculating and analysing segment-specific market share. This knowledge empowers them to make informed decisions, capitalise on growth opportunities, and develop strategies tailored to the unique characteristics of each segment.

Interpreting Market Share Results

Market share figures serve as a compass, guiding marketers through the dynamic business landscape. However, understanding the implications of these figures and extracting meaningful insights requires a keen eye for interpretation. 

Benchmarking

One of the most effective ways to interpret market share results is through benchmarking. Benchmarking involves comparing a company’s market share to industry averages, competitors, or historical data. By benchmarking against similar companies or industry standards, we can gauge our relative performance and identify areas of strength or areas that require improvement. This contextual comparison provides insights into the competitive dynamics and market positioning.

Industry Averages

Industry averages act as reference points for interpreting market share results. They provide a broader perspective on market norms and trends. We can assess our performance with the overall market by comparing a company’s market share to the industry average. A market share higher than the industry average signifies a stronger position, while a lower market share may indicate the need for strategic adjustments.

Trends and Patterns

Analysing trends and patterns in market share over time helps uncover valuable insights. By observing market share changes, marketers can identify shifts in customer preferences, competitive dynamics, or the effectiveness of strategies. A rising market share may indicate successful initiatives or market growth, while a declining market share might prompt the need for innovation or strategic redirection. Understanding long-term trends helps identify opportunities and anticipate future market movements.

Market Segmentation

Segment-specific market share analysis adds another layer of interpretation. Comparing market share figures within specific segments or product categories provides a deeper understanding of customer preferences and market dynamics. The segment-specific analysis highlights areas where a company holds a strong position or areas that require targeted efforts for growth. This information enables marketers to tailor strategies and allocate resources effectively to capture segment-specific opportunities.

Competitive Landscape

Interpreting market share results should consider the broader competitive landscape. Analysing competitors’ market share figures and strategies allows us to assess our competitive positioning. Understanding the relative market share and strategies of key competitors provides insights into the effectiveness of differentiation, branding, and market penetration efforts. This knowledge can guide us in refining our competitive strategies and seizing advantages in the market.

By incorporating benchmarking, industry averages, trend analysis, segment-specific insights, and a comprehensive understanding of the competitive landscape, marketers can extract deeper insights from market share results. This interpretation informs decision-making, highlights areas for improvement, and guides the development of effective strategies.

Leveraging Market Share Insights

Market share analysis is not merely an intellectual exercise but a catalyst for strategic decision-making and a guide to business success. 

Strategic Marketing

Market share insights serve as a compass, guiding marketing strategies and initiatives. Armed with a deep understanding of market share dynamics, marketers can identify growth opportunities, fine-tune targeting strategies, and allocate resources effectively. 

For instance, a company with a lower market share may focus on market penetration strategies to gain a larger piece of the market. A company with a higher market share may concentrate on defending its position through branding or differentiation strategies. Market share insights enable us to tailor our marketing efforts, optimise messaging, and engage with customers in a way that resonates and drives market share growth.

Product Development and Innovation

Market share analysis provides valuable input for product development and innovation. By examining market share trends and customer preferences, marketers can identify gaps in the market, unmet needs, and areas for product expansion or improvement. Understanding market share dynamics helps prioritise product features, enhance value propositions, and ensure alignment with customer demands. 

Companies that leverage market share insights to drive product development initiatives are better positioned to deliver offerings that capture market share and meet evolving customer expectations.

Competitive Positioning

Market share insights are an indispensable tool for assessing competitive positioning. By comparing market share figures with those of competitors, marketers can gauge their relative strength and identify opportunities for differentiation. Understanding competitors’ market share, strategies, and customer perceptions enables us to uniquely position our products or services. Whether through pricing strategies, branding initiatives, or service differentiators, market share insights help establish a distinctive competitive position that attracts customers and boosts market share.

Targeted Resource Allocation

Efficient resource allocation is crucial for maximising market share growth. Market share analysis helps marketers identify areas where resources should be strategically invested. Marketers can capitalise on expansion opportunities and outperform competitors by allocating resources to high-growth segments or product categories. Market share insights enable informed decisions on budget allocation, sales force deployment, marketing campaigns, and distribution channels, optimising resource utilisation and driving market share growth.

Competitive Intelligence

Market share analysis provides a window into the competitive landscape. Marketers can track the effectiveness of competitors’ strategies by monitoring market share changes, identifying emerging trends, and responding proactively. Competitive intelligence derived from market share insights helps uncover untapped market segments, evaluate potential threats, and identify opportunities for collaboration or acquisition. With this knowledge, marketers can make informed decisions to stay ahead and maintain or increase market share.

Real-world examples abound of companies successfully leveraging market share insights to gain a competitive advantage. Market share analysis has proven instrumental in driving business success, from identifying niche market opportunities to designing breakthrough products or executing targeted marketing campaigns.

keeping-up-with-Gen-z

Challenges and Limitations

As with any business metric, calculating market share comes with its share of challenges and limitations. Marketers need to be aware of these potential hurdles to ensure accurate and meaningful analysis. 

Data Limitations 

One of the primary challenges in calculating market share is the availability and reliability of data. Obtaining accurate and comprehensive data on sales figures, total market size, and competitors’ sales can be daunting. 

Companies may face data gaps, especially regarding competitors’ sales data, as this information is not always readily accessible. To mitigate this challenge, marketers can leverage industry reports, market research agencies, and competitive intelligence to estimate and validate data. 

Collaborating with market research agencies specialising in gathering market data can provide access to reliable and up-to-date information.

Market Dynamics

Markets are dynamic and constantly evolving. Changing consumer preferences, technological advancements, and economic shifts can impact market share calculations. For instance, market disruptions, new market entrants, or shifts in consumer behaviour may render historical market share data less relevant. To address this challenge, marketers should regularly update their market research, track industry trends, and adjust their analyses accordingly. Embracing agility and adaptability is key to ensuring market share calculations remain accurate and reflect the current market landscape.

Competitor Analysis

Accurately estimating competitors’ sales data can be a significant challenge. Companies may keep their sales figures private, making obtaining precise data for calculating market share challenging. 

To overcome this limitation, marketers can rely on industry reports, trade publications, and market research data to estimate or benchmark competitors’ market share. Engaging in competitive intelligence activities, such as monitoring competitor marketing strategies or conducting customer surveys, can also provide insights into competitors’ performance and market share estimates.

Data Accuracy and Reliability

Ensuring the accuracy and reliability of the data used in market share calculations is crucial. Inaccurate or incomplete data can lead to misleading market share results. Marketers should implement robust data collection methods, employ data validation techniques, and conduct thorough data quality checks. Regular audits and cross-referencing data from multiple sources help maintain data accuracy and reliability. 

Collaborating with market research agencies that adhere to stringent data quality standards can provide an added layer of confidence in the accuracy of the data used for market share analysis.

Market Share vs. Profitability

While market share is an essential metric, it is important to remember that it does not directly measure profitability. A company may have a significant market share but not generate substantial profits. 

It is crucial to consider other financial metrics, such as profit margins, return on investment, and revenue growth, in conjunction with market share analysis to understand business performance comprehensively. Balancing market share objectives with profitability goals ensures a holistic approach to business success.

By being aware of these challenges and limitations, marketers can proactively address them and enhance the accuracy and effectiveness of market share analysis. Leveraging the expertise of market research agencies, staying agile in response to market dynamics, and maintaining data accuracy are key strategies to overcome these obstacles and maximise the value of market share calculations.

Working with a Market Research Agency

Partnering with a market research agency can significantly enhance the accuracy, reliability, and depth of market share analysis. Agencies bring a wealth of expertise, resources, and industry insights to the table, enabling us to understand our market position comprehensively. 

Expertise and Specialisation

Market research agencies are experts in their field. They deeply understand market dynamics, data collection methodologies, and analytical techniques. Their specialised knowledge allows them to navigate the complexities of market share analysis, ensuring accurate calculations and meaningful interpretation of the results. Marketers can tap into this expertise by partnering with a market research agency to leverage their knowledge to gain valuable insights.

Access to Resources and Data

Market research agencies can access a wide range of resources and data sources that may not be readily available to individual companies. These resources include proprietary databases, industry reports, customer panels, and research methodologies. By collaborating with a market research agency, marketers can access a wealth of data that enriches their market share analysis, enabling them to make well-informed decisions based on comprehensive and up-to-date information.

Industry Insights and Trends

Market research agencies operate at the forefront of industry trends and developments. They continually monitor market shifts, emerging technologies, and consumer behaviours. By partnering with an agency, marketers gain access to these industry insights, which provide valuable context and help interpret market share results. Market research agencies can offer a broader perspective, identify emerging opportunities, and guide marketers in adapting their strategies to stay ahead in the market.

Data Collection and Analysis

Market research agencies excel in data collection, analysis, and interpretation. They employ robust methodologies and statistical techniques to ensure data accuracy and reliability. These agencies have established processes for data collection, including surveys, focus groups, interviews, and advanced analytical tools for data analysis. Marketers can obtain precise market share calculations and uncover actionable insights by leveraging their data collection and analysis capabilities.

Customised Solutions and Reporting

Market research agencies provide customised solutions tailored to the specific needs of their clients. They understand that each business is unique and requires a personalised approach to market share analysis. These agencies offer comprehensive reports, dashboards, or interactive visualisations that present market share data clearly and concisely. These customised deliverables empower marketers to derive actionable insights and effectively communicate findings within their organisations.

Continuous Monitoring and Updates

Market share analysis in a dynamic business landscape is not a one-time endeavour; it requires continuous monitoring and timely updates. To stay ahead in the market and make informed decisions, marketers need to track market share trends, analyse emerging patterns, and benchmark against competitors continuously. 

Tracking Market Share Trends: Continuous market share monitoring allows us to track changes and trends over time. By regularly analysing market share data, brands gain insights into their performance and how it compares to competitors. Identifying upward or downward trends helps marketers understand the effectiveness of their strategies, anticipate market shifts, and make timely adjustments. Continuous tracking of market share trends provides a pulse on the market and ensures that businesses are proactive in their decision-making.

Trend Analysis for Strategic Decision-making: Analysing market share trends helps businesses identify patterns and make informed strategic decisions. By assessing long-term market share data, marketers can identify growth opportunities, evaluate the impact of marketing initiatives, and adjust their strategies accordingly. Trend analysis provides a historical context, enabling marketers to determine the success of past actions and plan for the future. This proactive approach helps businesses adapt to changing market dynamics, seize opportunities, and maintain or increase market share.

Competitor Benchmarking: Regular updates on competitor market share performance are essential for maintaining a competitive edge. By benchmarking against competitors, marketers gain insights into their relative market position, market penetration, and success in specific segments. Continuous competitor benchmarking enables businesses to identify emerging threats, spot areas of competitive advantage, and refine their strategies accordingly. Marketers can react swiftly to changing market conditions by keeping a close eye on competitors and proactively protect or grow their market share.

Timely Reports and Dashboards: Market research agencies are vital in providing timely market share reports, dashboards, or customised solutions. These reports offer comprehensive and up-to-date market share analysis, enabling marketers to make data-driven decisions. Timely access to market share data helps businesses stay informed about their performance, identify trends, and evaluate the effectiveness of their strategies. Market research agencies deliver reports and dashboards that present market share insights in a clear, concise, and actionable manner, facilitating decision-making based on the latest market dynamics.

Customised Solutions for Decision-making: Market research agencies can provide custom solutions tailored to the specific needs of businesses. Whether it’s regular market share tracking, trend analysis, or competitive benchmarking, these agencies offer services that align with the unique requirements of their clients. Businesses receive the most relevant and actionable insights through customised solutions, enabling them to make well-informed decisions based on real-time market share data. This level of customisation ensures that brands have the tools to respond swiftly to market changes and maintain their market share advantage.

Brands gain a competitive edge by continuously monitoring market share, analysing trends, benchmarking against competitors, and accessing timely reports. Regular updates facilitate proactive decision-making, help identify growth opportunities, and ensure strategies remain aligned with market dynamics.

Final Thoughts

Market share analysis serves as a compass for businesses navigating the ever-changing business landscape. It provides valuable insights into a company’s position, competitive advantage, and growth potential. Understanding market share goes beyond mere calculations; it is about uncovering trends, identifying opportunities, and making strategic decisions.

By accurately calculating and interpreting market share, marketers can drive their strategies, optimise resource allocation, and stay ahead of the competition. Collaboration with market research agencies brings specialised expertise, robust methodologies, and industry insights to enhance market share analysis.

However, market share is just one piece of the puzzle. Profitability, customer satisfaction, and innovation are equally important. Market share alone does not guarantee success. It is crucial to strike a balance between market share objectives and long-term profitability goals.

As the business landscape evolves, continuous monitoring and timely updates are paramount. By tracking market share trends, benchmarking against competitors, and leveraging advanced analytics, businesses can adapt, make informed decisions, and seize emerging opportunities.

In the journey towards market share excellence, remember that market share is not an endpoint but a means to achieve sustainable growth. Embrace collaboration, embrace data-driven insights, and embrace the transformative power of market share analysis to propel your business toward success in an ever-evolving marketplace.

Take your market share analysis to new heights with Kadence International, a global leader in market research. Unlock the expertise, resources, and industry insights that will revolutionise your understanding of market dynamics. Partnering with Kadence means gaining a strategic advantage, as our proven track record and award-winning services will propel your business forward. Don’t settle for guesswork—choose the power of data-driven decision-making. Contact us today.

Stay ahead

Get regular insights

Keep up to date with the latest insights from our research as well as all our company news in our free monthly newsletter.

It makes sense to open up new markets for a successful product or service. But how do you know whether it’s worth the investment? What makes for a potential buyer in your home territory might not apply in a new location where the total addressable market could be much smaller or many times the size. Enter the market researchers. We explain how to calculate market potential.

Estimating sales can be a chore even when you have historical and well-honed market instincts to work with. But in a new market this is even harder. There’s no historical data to review and it’s challenging to estimate the kinds of expenses and risks that might crop up.

An inability to judge sales makes the decision of whether to enter a new market much harder. Without a decent estimate – of both sales and likely profits – it’s almost impossible to decide on how you might enter and what kind of investment to make there.

What’s the market really worth?

The starting point is to get a handle on the existing market for your brand or product in the new territory. A basic market analysis is a great starting point. Typically it breaks down into:

  • Market sizing (current and future)
  • Market trends
  • Market growth rate
  • Market profitability
  • Industry cost structure
  • Distribution channels
  • Key success factors

But within each category, there’s lots to research. A more superficial look at the data can be helpful for a ‘first cut’ look at which new markets you might want to enter. But a deeper dive into the numbers will be essential if you’re going to properly evaluate the strategy for what looks like a high-probability candidate.

That more sophisticated analysis could take the form of a total addressable market (TAM) analysis. This looks at both the TAM itself, as well as serviceable available market (SAM). This is the portion of TAM that your company’s products or services play inside; and serviceable obtainable market (SOM), the percentage of SAM which your might realistically reach.

Best guesses?

But getting to SOM for a brand new market isn’t a simple calculation. It’s not exactly easy in markets where you’re a known quantity and understand the competitive environment, either! For businesses in mature categories and with previous experience of being a new entrant to markets, it’s possible to make educated guesses. This can be refined with local research on factors that might shape consumer behaviour.

In some industries that data might be possible to obtain – from industry associations, for example, or government agencies. In others – and particularly in product segments that a relatively underdeveloped in the market you plan to enter – sales figures might be harder to come by.

Then there’s the difficulty of calculating market share. You will know what it might cost in contracts, infrastructure and marketing to build share in existing markets. But the assumptions may be way off-base for a brand new market.

Stay ahead

Get regular insights

Keep up to date with the latest insights from our research as well as all our company news in our free monthly newsletter.

Talk to people

At this point there are two avenues:

Research sales results that have been achieved by other companies like yours. They don’t even need to be in precisely the same line of business. The lessons of other companies looking to sell into the new markets can reveal both the optimum routes in, the barriers to adoption and the appetite for new brands.

That might even mean contacting other businesses to ask their experience of making the adaptation to the new market – as well as learning about potentially important busy and slow seasons, noteworthy business practices and quirks of the system that might not have a direct bearing on the size of the opportunity, but will allow you to adjust your assumptions.

Talking to local partners, however, is probably the best way of calibrating your expectations. Even if you plan to enter a market by establishing a local entity and investing in your own facilities and marketing, you’ll still be working with many different counterparties. This can span everything from local professional services firms such as lawyers and accountants, to warehousing, distribution or media buying agencies.

They ought to be able to offer anecdotal evidence at the very least; at best, they’ll have insights into the size of the market and chances of capturing that crucial market share. And if the route to market entry is contracting with a local distributor, licensees or franchisees, their sense of the opportunity could be invaluable.

But above all, rigorous quantitative and qualitative market research will reveal a great deal about attitudes and appetites for your brand or product. The more you can contextualise the hard data on existing spend and potential market growth with consumer insight, the more realistic your evaluation will be.

Focusing on behaviour

One other way to address uncertainties about how a new market might embrace a product or service is to think not about that category, or even look at domestic rivals’ sales and strengths. It’s to create a strategy based on consumer behaviours.

If you can analyse why your brand, product or service is successful in its existing markets and break down the results into some key motivators or even behavioural traits of your consumers, it might be possible to assess where those traits are visible in a new market before you enter. In what situations is your product used? What type of people love it? What are those customers’ attitudes across different domains? What role does it play in their lives – and why?

That will require some pretty deep insight into the market you want to enter. Clearly it’s a more useful investment to make if there are other positive signals to encourage you in – fundamentals such as infrastructure, spending power or pre-existing local interest in your brand or product.

How good is your cost analysis?

Knowing your potential sales, market share and growth are all important. But the scale of the opportunity isn’t just sales – it’s profit. And even seasoned businesspeople can misstep when it comes to keeping costs under control in their market entry strategy. Here’s a brief list of costs that won’t affect domestic-only businesses:

  • Shipping costs – which can also fluctuate wildly, as we’re finding out during the COVID-19 pandemic. Consider, also, capacity. Shipping out of markets with a high balance of trade deficit (Europe, US, UK) to major exporters (China, for example) is much easier than going the other way.
  • Legal expenses – from registering a business in a new location, sorting out licensing, contracts, the right insurance cover… and complying with local regulations on everything from product labelling to anti-bribery laws.
  • Foreign taxes – and other local accounting quirks, which might be different depending on your headquarters domicile and the mode of entry into the market.
  • Translation services – for everything from contracts and technical specs, to instruction manuals and marketing.
  • Recruitment and HR – even a light-touch market entry will benefit from putting some employees into the new market to oversee set-up and manage local relationships.
  • Travel expenses – for the above, but also for ongoing check-ins with local teams or business partners.

What do you know about rivals?

Some lucky businesses will find an overseas market where there are few local rivals, legal and business structures that allow them to port across their defensive attributes from existing markets and a ready but as-yet-untapped consumer base. But those will be rare. So to properly understand the market potential, you’ll need competitor analysis. Our typical approach to this considers:

  • Who are your rivals in that market? Not just currently selling what you want to sell, but addressing your potential customers, too.
  • What is their range of products? How easily might they change?
  • How do they pitch their consumers? What messages are they using? Which channels?
  • What is their competitive advantage? What’s their cost base like? What could you replicate – and where can you out-compete them?
  • What’s their market share? How fragmented in the competition? What opportunities does that present either in terms of the industry cost-base or even acquiring smaller rivals?
  • What is their company structure? If they outsource (for supply or support) or license (to address the market), could those be vulnerabilities increasing your potential strength?

In summary

A lack of prior experience and knowledge can make it challenging for companies to assess the potential of new markets. We help lots of business overcome this – not just through the use of primary and secondary market research, but also by having people on the ground in many countries and regions to add specific local knowledge.

This creates a much more rounded view of the market potential – and the optimum ways to tap into it – than simply applying a cookie-cutter approach to market entry. The key steps:

  • Understand the demographic and economic drivers that underpin the total market for your products or services.
  • Think laterally about the broader factors – such as the types of consumer and cultural attitudes – that dictate market size.
  • Analyse existing market activity to deduce a TAM, SOM and SAM.
  • Conduct consumer research to evaluate your specific opportunity in the market.
  • Competitor intelligence will help you test assumptions about potential market share gains.
  • Rigorous local insights into costs and risks will reveal the profit potential – the ultimate rationale for market entry

Find out more about our market entry services, read our expert guide to market entry or get in touch with us to discuss a project with our team.

How do you calculate your market size and determine your serviceable obtainable market?

Understanding your market is a vital step in building a strong business case. It enables you to quantify the number of potential customers and estimate your revenue potential. If you’re new to the concept, start by exploring what is market size to get clarity on the fundamentals before diving deeper into the models. Accurate sizing helps secure internal buy-in, allocate resources, and prioritise opportunities with confidence.

Top-down market sizing is one of the two primary techniques used to calculate the serviceable obtainable market (SOM). This article explores what top-down market sizing entails, how to apply it, and the benefits and limitations of this approach.

What is top-down market sizing and how does it work?

There are two main approaches to estimating your serviceable obtainable market: top-down and bottom-up. Each method offers a different perspective on how to define your market opportunity.

  • Top-down market sizing begins with a macro-level view of the total addressable market (TAM)—the entire revenue opportunity available if every potential customer were to choose your product or service. From there, you narrow the focus to your serviceable available market (SAM), which includes only those customers your offering can realistically reach based on product fit, geography, or business model. Finally, the serviceable obtainable market (SOM) refers to the portion of the SAM that you can actually capture, given your resources, competition, and reach.
  • In contrast, bottom-up market sizing starts with your business fundamentals—your product, pricing, distribution, and existing customer base. From there, you build upwards, estimating how those units can scale over time. This method focuses on operational realities and helps model growth based on specific inputs, rather than general assumptions.

Comparing TAM, SAM, and SOM

To help visualise the differences between these three market size tiers, here’s a simple breakdown:

Market Size TermDefinitionExample
TAMTotal market demand for your product or serviceAll meal kit buyers in the UK
SAMThe portion of TAM you can serve based on business model and capabilitiesUrban households with broadband
SOMThe portion of SAM you can realistically win in the short term2% of urban households with broadband

This comparison gives a clear snapshot of how broad market figures are refined into realistic, actionable segments. Whether you’re assessing your current position or sizing up a new launch, distinguishing between TAM, SAM, and SOM is a vital step in making grounded commercial decisions.

How to apply top-down market sizing in practice

To apply top-down market sizing effectively, start by taking a wide-angle view of the total market before narrowing down to your realistic opportunity. This method begins at the macro level, using available industry data to assess the largest possible market size your product or service could address.

The first step is identifying your total addressable market (TAM). Look at reputable industry reports, government databases, and analyst forecasts to understand the size and scope of the broader market. From there, narrow this to your serviceable available market (SAM)—the subset of customers that your product could logically serve, based on location, product features, or business model constraints.

Let’s say you are launching a payment management platform for hair salons in the US. You would begin by estimating the total number of salons across the country. Then, refine the segment: remove those that are too small to need a digital system, or those operating in regions where your business does not currently operate. Next, account for existing clients and competitors—salons that are already served or unlikely to switch—until you are left with a realistic estimate of your serviceable obtainable market (SOM).

To strengthen your approach:

  • Use trusted data sources. Analysts like Gartner, Statista, or government bodies such as the Bureau of Labor Statistics can provide foundational data. Supplement this with primary research to validate assumptions and add nuance.
  • Maintain consistency. Use a clear, repeatable methodology and document your data sources and assumptions for transparency.
  • Interrogate the data. Ask critical questions as you work through the sizing: Who are our ideal customers? Where are they located? What share of this segment can we realistically convert?

Accurate market sizing is not just a numbers exercise—it sets the foundation for strategic planning, forecasting, and investor confidence.

Worked Example: Calculating Top-Down Market Size

Imagine you’re launching a new meal kit service in the UK. Here’s how you might size the market using a top-down approach:

  • TAM (Total Addressable Market):
    Start with the number of UK households (28 million). Let’s assume 60% are open to subscription services → 16.8 million.
  • SAM (Serviceable Available Market):
    Focus on urban households with broadband access and sufficient disposable income. Say that’s 50% of your TAM → 8.4 million.
  • SOM (Serviceable Obtainable Market):
    Based on marketing budget, delivery infrastructure, and competitive landscape, you estimate you can capture 2% in the next 3 years → 168,000 households.

Top-down and Bottom-up Market Sizing — Which is Better?

There’s no universal answer to which method is superior—it depends on your product, industry, and growth stage. Both top-down and bottom-up market sizing offer valuable perspectives and are often most effective when used together to cross-validate your estimates. Below, we outline the strengths and limitations of each approach to help you choose the most appropriate one.

Top-down Market Sizing

ProsCons
Quicker to execute—ideal when time or resources are limitedRelies on third-party data that may be outdated or not tailored to your specific business
Leverages existing market reports and analyst data, making it suitable for large, mature industriesNot well-suited for innovative, niche, or emerging categories with limited historical data
Provides a broad, investor-friendly view of market opportunityLacks granularity and may overlook critical micro-level dynamics such as distribution bottlenecks or customer behaviour

Bottom-up Market Sizing

ProsCons
Built on your actual sales model, pricing, and operational footprint—making it highly customisedCan be time-consuming and resource-intensive, especially without strong internal data tracking
Better suited to disruptive innovations or new product categories where historical data is unreliableRisk of compounding small errors across calculations, leading to inflated market size estimates
Enables detailed forecasting by linking market size directly to your business inputs (e.g. units sold, price, conversion rates)May be overly conservative if market expansion potential is underestimated

In practice, many successful brands apply both models. The top-down approach paints the bigger picture, while bottom-up offers a ground-level view rooted in operational reality. When both tell a consistent story, you can move forward with stronger conviction.

Ultimately, using both models in your market sizing can be useful. If they both agree, you can assume you have a reasonably accurate market size estimate. The approach you opt for will also depend on the type of business you’re building and the product you’re selling.

Why Market Sizing Should Be an Ongoing Process

While market sizing is essential for initial planning, it shouldn’t be treated as static. Markets shift. New competitors emerge. Consumer behavior evolves. That’s why the most successful brands revisit their estimates regularly—especially when expanding into new regions or launching new products.

In global contexts, market sizing becomes even more complex. Brands must factor in cultural nuances, economic conditions, and local demand patterns. Combining top-down and bottom-up approaches can help validate assumptions and reduce risk.

If you’re preparing to enter a new market, you may also find it helpful to explore our advanced techniques to calculate market size globally and dive into the nuances of how to calculate market potential in specific categories.

Market sizing is more than just a numbers game. When done right, it becomes a strategic tool to guide investment, align internal stakeholders, and prioritise where to compete. Whether you’re just starting out or fine-tuning a go-to-market strategy, it pays to get your numbers right.

Partner with Kadence to Build a Robust Market Sizing Strategy

At Kadence, we don’t just calculate market size—we help brands turn that data into direction. Whether you’re exploring a new category, entering an unfamiliar region, or reassessing your growth strategy, our market sizing services can help you build an accurate, defensible model that guides smart decision-making. Get in touch to see how our research can power your next move.

Stay ahead

Get regular insights

Keep up to date with the latest insights from our research as well as all our company news in our free monthly newsletter.

Frequently Asked Questions

Q: What is the difference between TAM, SAM, and SOM?
A: TAM (Total Addressable Market) is the total demand for a product or service in a given market. SAM (Serviceable Available Market) refers to the portion of TAM you can actually serve based on your business model, region, or capabilities. SOM (Serviceable Obtainable Market) is the realistic share of that market you can capture, considering your resources and competition.

Q: When should I use top-down market sizing instead of bottom-up?
A: Top-down market sizing is ideal when you need a quick estimate and have access to reliable secondary data sources—such as industry reports or government statistics. It works best for mature industries with established competitors and historical data.

Q: How do I calculate SOM from TAM or SAM?
A: First, estimate your TAM using high-level data. Then define your SAM by narrowing this to only the segment your product can serve. From there, calculate SOM based on your expected market penetration rate or the percentage of the SAM you believe is attainable, factoring in competitors and current reach.

Q: Is it better to use both top-down and bottom-up methods?
A: Yes. Combining both approaches provides a more robust and accurate estimate. If both methods converge on a similar figure, it can increase your confidence in the forecast. This is especially helpful for cross-functional alignment or when seeking investment.