Did you know that, on average, shoppers spend just two seconds deciding whether to pick up a product or not? In that short amount of time, packaging has to grab their attention, communicate key information, and entice them to purchase. As a marketer, understanding the psychology behind the packaging is essential for capturing those fleeting moments and making the most of your opportunity on the shelf. In this blog, we’ll explore the fascinating research into shopping behaviour and eye-tracking studies and show you how to design packaging that influences consumers’ decisions. So, if you want to know the secrets to gain consumers’ attention from a shelf, keep reading!

The Science of Shopping Behavior

To create effective packaging, it’s essential to understand how shoppers behave in a store. Numerous studies into shopping behaviour offer key insights into how to design packaging that resonates with your target audience.

One important insight is that shoppers tend to make decisions based on emotion rather than logic. Packaging that conveys a sense of excitement, pleasure, or indulgence is more likely to attract their attention than packaging that simply lists the product’s features.

Another crucial insight is that shoppers look at a product’s upper left corner first. This area should contain the most vital information, such as the product’s name or a key benefit. 

It is important to note that this insight is based on eye-tracking studies conducted primarily in Western societies, such as the United States and Europe. Shoppers in other countries may have different eye-tracking patterns or prioritise different areas of a product’s packaging. 

Finally, shoppers prefer products that are easy to understand and use. Clear and concise communication on packaging regarding the product and its usage will help the product stand out on the shelf.

Stay ahead

Get regular insights

Keep up to date with the latest insights from our research as well as all our company news in our free monthly newsletter.

The Power of Eye-Tracking Studies

While studies into shopping behaviour can provide valuable insights, they can also be limited by the self-reported nature of the data. Researchers have turned to eye-tracking studies to get a more accurate picture of how shoppers behave in-store.

Eye-tracking technology allows researchers to see where shoppers are looking and for how long. This provides a more objective way of measuring shopper behaviour and can reveal insights that might not be captured through self-reported data.

One key finding from eye-tracking studies is that shoppers focus on the front of the package first, then move on to the sides and back. That means that the front of your package needs to be eye-catching and convey essential information clearly and concisely.

Another important insight from eye-tracking studies is that shoppers tend to look at products at eye level more than those that are higher or lower. If your product is on a lower or higher shelf, you may need to use packaging design elements that stand out even more to attract attention.

Eye-tracking studies can also reveal how shoppers scan a package for information. For example, they tend to look at the product name, the image or graphic, and then any claims or benefits listed on the front of the package.

By using the insights from eye-tracking studies, you can design packaging that is even more effective at attracting attention and communicating key information to your target audience. 

Designing Packaging to Stand Out

Now that we better understand how shoppers behave in-store and the insights gained from eye-tracking studies, let’s explore some specific design elements that can help your packaging stand out on the shelf.

Colour

Colour is one of the most powerful design elements for attracting attention. Using bold and bright colours can help your product stand out. Consider using colours not commonly seen in your product category to make your product even more distinctive. 

However, colour can be perceived differently in different countries, and marketers need to be aware of these differences when designing packaging for a global audience. For example, in Western cultures, black is often associated with luxury and sophistication, while in some Eastern cultures, it is associated with mourning and sadness. Similarly, the colour red is often associated with love and passion in Western cultures, while in some Asian cultures, it is associated with luck and prosperity.

It’s also important to consider the context in which the product will be sold, as colours can have different meanings in different contexts. For example, green may be associated with nature and health in some contexts, but it may relate to money and finance in others. By carefully considering the cultural and contextual implications of colour, marketers can create packaging that effectively communicates the product’s value and resonates with the target audience.

Typography

Typography refers to the style, size, and arrangement of text on your packaging. Using clear and easy-to-read fonts can help shoppers quickly understand what your product is and what it offers. It is also important to note there can be differences in buyer behaviour and preferences regarding typography in different cultures. 

For example, in many Asian cultures, calligraphy and other forms of intricate handwriting are highly valued, and this may influence the types of typography that are preferred by consumers. Similarly, different scripts and writing systems may have different connotations and associations in different cultures, impacting buyer behaviour. 

It’s worth noting that typography can also significantly impact accessibility and readability for people with visual impairments or other disabilities. Designing clear and easy-to-read typography can help ensure your product is accessible to the broadest possible audience, regardless of cultural or linguistic background.

Imagery

Compelling imagery can help your product stand out and connect with shoppers emotionally. Consider using high-quality photos or illustrations that convey the benefit or feeling your product provides.

Packaging Shape

The shape of your packaging can also help it stand out on the shelf. Consider using unique shapes or structures different from the typical packaging in your product category.

Branding 

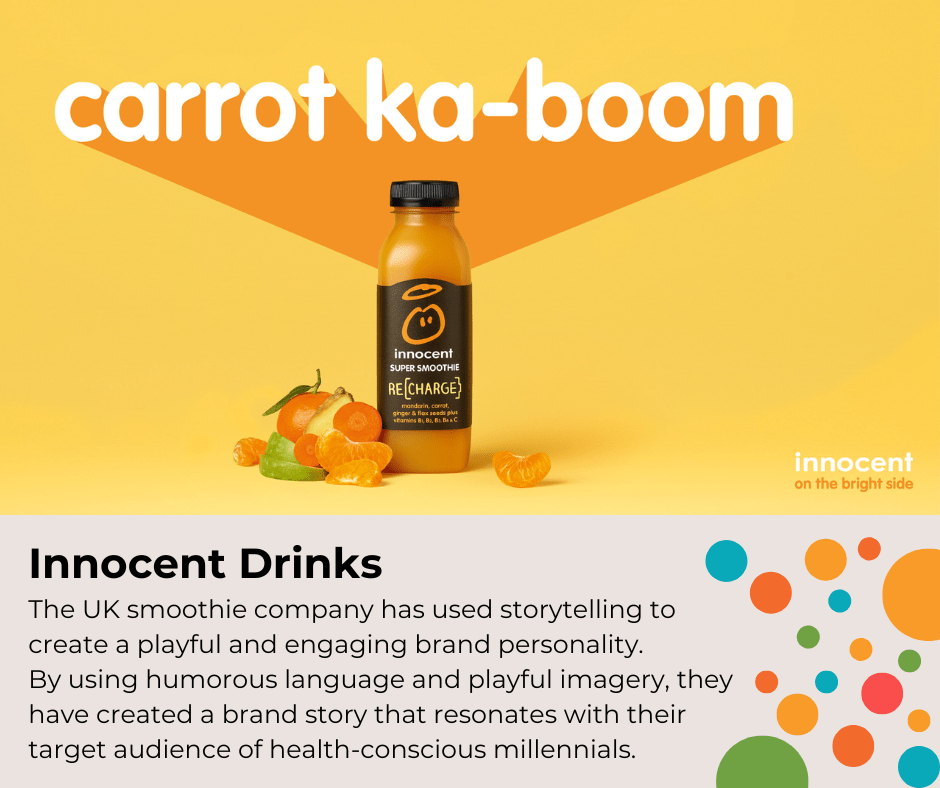
Finally, branding can also play a crucial role in attracting attention and building loyalty. Ensure your packaging design is consistent with your brand identity and conveys your brand values.

Real-World Examples of Successful Packaging Design

One of the best ways to learn about effective packaging design is to look at real-world examples. Here are a few successful packaging designs that have used the principles we’ve discussed:

  1. Burt’s Bees: Burt’s Bees packaging stands out on the shelf with its natural, earthy colours and simple, elegant typography. Using natural images and illustrations of bees and flowers helps to communicate the brand’s commitment to using natural ingredients.
  2. Oatly: Oatly’s packaging for their dairy-free milk products stands out on the shelf with its bold use of typography and graphics. The packaging features a simple black and white design with clever and irreverent messaging, such as “It’s like milk, but made for humans.”
  3. Chobani: Chobani’s yoghurt packaging features a distinctive, curved shape that differentiates it from other yoghurt brands. The packaging also features bold, colourful graphics and typography that help it stand out on the shelf.
  4. Method: Method’s cleaning product packaging features bright, cheerful colours and playful illustrations that help it stand out from the typically bland and boring cleaning products. The packaging also features witty product names that add to the brand’s playful personality.
  5. Nivea: Nivea’s skincare packaging features a simple, classic design that has become synonymous with the brand. The packaging features a clean, white background with the brand’s iconic blue logo, which helps it stand out on the shelf and communicate its commitment to quality skincare products.

A Case Study on Packaging that Missed its Mark

While the above are great examples of packaging that resonate well with buyers, marketers can also learn from many packaging failures.

Case Study: Bic For Her

In 2012, Bic introduced a line of pens called “Bic For Her,” marketed as pens designed specifically for women. The pens featured pastel colours and a thinner barrel size and were priced higher than regular pens. The packaging also included a tagline “Designed to fit comfortably in a woman’s hand.”

The product was met with widespread criticism and mockery on social media, with many people questioning why women would need pens explicitly designed for them. Some critics also pointed out that the pens were more expensive than regular pens, despite offering no significant additional features or benefits.

There are several steps that Bic could have taken to avoid the Bic For Her disaster. Here are a few possible strategies:

  1. Conduct Research: Before launching a new product, it’s essential to conduct thorough market research to understand the needs and preferences of your target audience. In the case of Bic For Her, Bic could have conducted surveys or focus groups to better understand whether there was a demand for pens designed specifically for women.
  2. Avoid Stereotypes: The marketing of Bic For Her relied heavily on gender stereotypes, such as the idea that women have delicate hands that require special pens. To avoid this, Bic could have focused on creating marketing messages that were more inclusive and resonated with a diverse range of consumers.
  3. Price the Product Appropriately: One of the criticisms of Bic For Her was that the pens were priced higher than regular pens, despite offering no significant additional features or benefits. To avoid this, Bic could have priced the product more competitively or provided clear and compelling reasons why the pens were worth the higher price.
  4. Test the Product: Before launching a new product, testing it with a smaller audience is vital to see how it is received. In the case of Bic For Her, Bic could have tested the pens with a smaller group of consumers to see whether the product resonated with them before launching it on a larger scale.
  5. Learn from Feedback: When the negative feedback about Bic For Her started to emerge, Bic could have responded more quickly and effectively to address the concerns. 

By taking these steps, Bic could have avoided the Bic For Her disaster and created a product that resonated with consumers and drove sales. The key is to understand your target audience, create marketing messages that are inclusive and relevant, and be responsive to feedback and criticism when it arises.

While Bic For Her was widely criticised, the brand was able to learn from its mistakes and move forward. In subsequent marketing campaigns, Bic focused on creating messages that resonated with all consumers, regardless of gender. By acknowledging their missteps and making changes based on feedback, Bic was able to salvage its brand reputation and avoid making similar mistakes in the future.

Putting It All Together

Now that we’ve explored the psychology of shopping behaviour, the power of eye-tracking studies, and specific design elements that make packaging stand out, let’s bring it all together.

A deep understanding of your target audience is essential to create effective packaging. What are their values, preferences, and pain points? How can your packaging address those needs and stand out from the competition?

Once you clearly understand your audience, you can incorporate the design elements we’ve discussed. Consider using bold, bright colours, clear and easy-to-read typography, compelling imagery, unique packaging shapes, and consistent branding.

It’s also important to communicate key information clearly and concisely. What is your product? What are the key benefits or features? Why should consumers choose your product over the competition?

Finally, don’t be afraid to be creative and have fun with your packaging design. Consumers are drawn to brands that have personalities and stand out from the crowd. By incorporating unique design elements and messaging that reflect your brand’s personality and values, you can create packaging that resonates with your target audience and leads to increased sales.

Testing Your Packaging Design

After you’ve invested time and resources into creating effective packaging, testing your design to ensure it resonates with your target audience is important. Here are a few methods for testing your packaging design:

  1. Surveys: One of the simplest ways to test your packaging design is to survey your target audience. You can show them different packaging designs and ask for feedback on their preferred design and why. This can provide valuable insights into what design elements are most appealing to your audience.
  2. Focus groups: Conducting a focus group is another effective method for testing your packaging design. This involves bringing together a group of individuals from your target audience and showing them your packaging design. You can then ask for their feedback on what they like and don’t like about the design and what changes they would suggest.
  3. A/B testing: A/B testing involves creating two different versions of your packaging design and testing them against each other to see which performs better. This can be done through online surveys or by conducting in-store tests.
  4. Eye-tracking studies: Eye-tracking studies can provide valuable insights into how shoppers interact with your packaging design. Eye-tracking technology lets you see which design elements attract the most attention and how shoppers scan the package for information.

Testing your packaging design ensures that it resonates with your target audience and leads to increased sales. This investment in testing can ultimately save you time and money in the long run by ensuring that your packaging design is effective before it goes to market.

Adapting Your Packaging Design Over Time

Even the most effective packaging designs may need to be adapted over time to stay relevant and resonant with your target audience. Here are a few reasons why you may need to adapt your packaging design:

  1. Changes in consumer preferences: Consumer preferences and values can change over time, which may require you to adapt your packaging design to stay relevant. For example, if consumers become more concerned about sustainability, you may need to incorporate eco-friendly packaging materials into your design.
  2. Changes in the competitive landscape: Your competitors may change their packaging designs, requiring you to adapt your design to stand out from the crowd. Keeping an eye on your competitors and their packaging designs can help you stay ahead of the curve.
  3. New product features or benefits: If your product evolves and offers new features or benefits, you may need to update your packaging design to communicate those changes effectively.
  4. New marketing strategies: If you change your marketing strategy, you may need to adapt your packaging design to align with those changes. For example, if you shift your focus to a new target audience, you may need to adapt your packaging design to appeal to that audience.

Packaging design captures consumers’ attention, communicates key information, and drives sales. By understanding the psychology of shopping behaviour, utilising eye-tracking studies, and incorporating key design elements, you can create packaging that stands out on the shelf and resonates with your target audience.

Starting with a deep understanding of your target audience, you can incorporate design elements such as bold colours, easy-to-read typography, compelling imagery, unique packaging shapes, and consistent branding to create effective packaging. Communication of key information clearly and concisely is important, as is creativity and personality in your design to stand out from the competition.

Testing your packaging design using surveys, focus groups, A/B testing, and eye-tracking studies is essential to ensure it resonates with your target audience. Regular evaluation and adaptation of your packaging design can help you stay relevant and effective over time.

By investing in effective packaging design, you can set your product apart from the competition and increase your chances of success in the competitive world of retail. So, take the time to invest in your packaging research and design, and watch as your sales soar.

Kadence International has expertise with the world’s leading brands in package testing. Get in touch or submit a research brief.

As a marketer, you’re constantly juggling multiple priorities. You need to develop compelling campaigns that resonate with your target audience, stay ahead of the competition, and demonstrate the value of your products or services. With so much to do, it can be tempting to skip the research phase and jump straight into execution mode. However, this can be a costly mistake. Your marketing efforts will likely fall flat without a solid understanding of your customer’s needs, preferences, and pain points.s

That’s where market research comes in. By conducting research, you can gather valuable insights into your target audience and use these insights to inform your marketing strategy. However, knowing when to conduct research and how to do it right can be challenging. 

In this article, we’ll explore some telltale signs that indicate it’s time to conduct research and provide practical tips on how to conduct research effectively. Whether you’re a seasoned marketer or just starting out, this article will help you navigate the marketer’s dilemma and make informed decisions that drive growth.

Signs that It’s Time to Conduct Research

Several telltale signs indicate it’s time to conduct research. If you’re experiencing any of the following issues, it may be time to consider conducting research:

  • Declining Sales: If you’ve noticed a decline in sales, it could be a sign that your marketing strategy is no longer effective. Conducting research can help you identify the root cause of the decline and develop a plan to turn things around.
  • Customer Complaints: Are you receiving a lot of complaints from customers? This could indicate that your products or services aren’t meeting their needs. Research can help you understand what’s causing the complaints and how to address them.
  • Lack of Customer Engagement: If your customers aren’t engaging with your brand or products, it may be time to conduct research to understand why. This can help you develop more effective marketing campaigns that resonate with your target audience.
  • New Competitors: If new competitors have entered the market and are gaining market share, it’s important to conduct research to understand what they’re doing differently and how you can stay ahead.

Changing Market Conditions: Markets constantly evolve; what worked yesterday may not work today. Conducting research can help you stay up-to-date on changing market conditions and adjust your strategy accordingly.

Steps to Take Before Conducting Research

Before conducting any research, you must take some preparatory steps to ensure you’re clear on what you want to achieve. Here are some steps to consider:

  1. Define the Problem: The first step is to define the problem you’re trying to solve. What questions do you need answers to? What insights are you hoping to gain? It’s essential to be clear on the problem before embarking on any research.
  2. Set Research Objectives: Once you’ve defined the problem, you must set research objectives to help you achieve your goal. These objectives should be specific, measurable, achievable, relevant, and time-bound (SMART). For example, if you’re trying to understand why sales have declined, your research objective might be to identify the key factors contributing to the decline.
  3. Identify the Target Audience: Next, you must identify your research’s target audience. Who are you trying to reach? What characteristics do they have? It’s essential to define your target audience so that you can design research that will yield meaningful insights.
  4. Choose the Right Research Methodology: There are many different research methodologies available, such as surveys, focus groups, interviews, and observational research. Each method has pros and cons; the right choice will depend on your research objectives and target audience. Choosing the right methodology ensures you get the insights you need.
  5. Develop the Research Instrument: Once you’ve chosen your methodology, you need to develop the research instrument – the tool you’ll use to collect data. This might be a survey questionnaire, a discussion guide for a focus group, or an interview protocol. It’s important to design the research instrument carefully to ensure you collect high-quality data.
beverage-trends

Crafting the Right Research Question

Once you’ve defined the problem, set research objectives, identified the target audience, and chosen the right research methodology, the next step is to craft the right research question. The research question should be clear, concise, and focused on the problem you’re trying to solve. In addition, you can develop supplemental questions to provide more context and depth around the issue. Here are some tips for crafting the right research question and creating additional questions:

  1. Start with a Broad Question: Begin by crafting a broad research question that captures the main issue you’re trying to address. For example, if you’re trying to understand why sales have declined, your general research question might be, “What factors are contributing to the decline in sales?”
  2. Narrow the Question: Once you have a broad research question, you need to narrow it down to something more specific. This will help you focus your research and ensure you’re collecting the correct data. For example, you might narrow your research question to “What are the key drivers of customer churn?”
  3. Make the Question Measurable: It’s important to make your research question measurable so that you can collect data that will help you answer it. For example, you might ask, “What percentage of customers who churn cite price as a factor?”
  4. Ensure the Question is Relevant: The research question should be relevant to the problem you’re trying to solve and the research objectives you’ve set. Ensure that the question will yield insights to help you make informed decisions.
  5. Keep the Question Simple: Keep the research question simple and easy to understand. This will help ensure that participants can answer it accurately and that you can analyse the data effectively. Let’s say you’re conducting research to understand why customers are not using a new feature on your product. Instead of asking a complex question like, “How do you feel about the usability of the new feature compared to previous versions of the product?” which may confuse participants, consider asking a simple and direct question like “Are you currently using the new feature?” This question is easy to understand and can be answered with a simple “yes” or “no,” making it easier for participants to answer accurately and for you to analyse the data effectively. 
  6. Develop Supplemental Questions: Once you have the key question, develop supplemental questions that provide more context and depth around the issue. These questions should help you understand the nuances of the problem and provide a more comprehensive view of the issue. For example, suppose you’re trying to understand why sales have declined. In that case, you might develop supplemental questions such as “How has customer sentiment changed over time?” or “What are customers saying about our competitors?”

Conducting the Research

Once you’ve defined the problem, set research objectives, identified the target audience, chosen the right research methodology, and crafted the right research questions, it’s time to conduct the research. Here are some tips for conducting the research effectively:

  1. Recruit Participants: Depending on your research methodology, you’ll need to recruit participants who fit your target audience. This might involve contacting customers via email, social media, or in-person events. Make sure to screen participants carefully to ensure they meet your established criteria.
  2. Structure the Research: Once you’ve recruited participants, you must structure the research to yield meaningful insights. For example, if you’re conducting a focus group, you might structure the discussion around key topics or questions. If you’re conducting a survey, you must design the questionnaire carefully to ensure you’re collecting the data you need.
  3. Collect Data: The next step is to collect the data. This might involve recording the discussion in a focus group, administering a survey online or in-person, or conducting interviews. Make sure to collect the data in a way that is consistent with the research methodology you’ve chosen.
  4. Analyse the Data: Once you’ve collected the data, you must identify patterns and insights. This might involve coding the data, running statistical analyses, or using qualitative analysis techniques. Analyse the data rigorously to ensure the insights are accurate and meaningful.
  5. Draw Conclusions: Finally, use the insights you’ve gained from the research to draw conclusions and inform your marketing strategy. What did you learn from the study? How can you use these insights to address the problem you identified at the beginning of the research process?
fitness-trends

Interpreting the Results

Once you’ve researched and analysed the data, it’s time to interpret the results and use them to inform your marketing strategy. Here are some tips for interpreting the results effectively:

  1. Look for Patterns: As you review the data, look for emerging patterns and trends. Are there any common themes or issues that participants identified? What insights can you gain from the data?
  2. Compare Results: If you conducted multiple research methods, compare the results to determine any consistencies or discrepancies. This can help you triangulate the data and ensure accurate insights.
  3. Consider the Context: When interpreting the results, it’s essential to consider the context in which the research was conducted. What external factors might be impacting the results? How do the results align with what you know about the market and your target audience?
  4. Draw Meaningful Conclusions: Based on the insights you’ve gained from the research, draw meaningful conclusions that will inform your marketing strategy. What changes do you need to make to your strategy? What opportunities can you pursue based on the insights?
  5. Communicate the Results: Finally, communicate the research results to your organisation’s stakeholders. This might include senior leadership, sales teams, or product development teams. Communicate the results clearly and effectively, and emphasise how they can be used to drive business growth.

Key Takeaways

The marketer’s dilemma of knowing when to conduct research and how to do it right is a challenge many marketers and product marketing managers face

However, by following best practices and taking a structured research approach, you can gather valuable insights into your target audience and use these insights to inform your marketing strategy.

  • Defining the problem is the first step in conducting research, followed by setting research objectives, identifying the target audience, choosing the correct methodology, and crafting the right research question.
  • Signs that indicate it’s time to conduct research include declining sales, customer complaints, lack of customer engagement, new competitors, and changing market conditions.
  • Conducting research involves recruiting participants, structuring the research, collecting data, analyzing the data, and drawing conclusions.
  • Interpreting the results involves looking for patterns, comparing results, considering the context, drawing meaningful conclusions, and communicating the results to stakeholders.
  • By taking a strategic approach to research and using the insights gained to inform your marketing strategy, you can develop compelling campaigns, stay ahead of the competition, and drive business growth.

No matter your experience level, prioritising research and using it to inform your marketing strategy is crucial for driving business growth. Following the steps outlined in this article, you can conduct research that yields valuable insights and helps you make informed decisions. 

If you’re ready to take the next step and conduct a research project, consider working with a trusted partner like Kadence International. With 30 years of expertise and offices in 10 countries, Kadence is a leading and award-winning market research firm that can help you conduct research that delivers actionable insights. Contact us to learn more and get started on your next research project.

Stay ahead

Get regular insights

Keep up to date with the latest insights from our research as well as all our company news in our free monthly newsletter.

In today’s world, data has become an essential asset for businesses. However, collecting data alone is insufficient; it must be analyzed and turned into meaningful insights. This is where predictive analytics comes in. 

Predictive analytics is the use of statistical algorithms, machine learning, and data mining techniques to analyze historical data and make predictions about future events or trends.

Predictive analytics has been around for a long time, with roots dating back to the early 1800s. One of the earliest known examples of predictive analytics is the work of the English statistician Francis Galton, who used statistical techniques to predict the height of children based on the height of their parents. Since then, predictive analytics has evolved significantly and is now a critical component of modern business intelligence.

Predictive analytics has many names, such as advanced analytics, data mining, and machine learning. However, they all refer to the same basic concept of using data to make predictions.

The importance of predictive analytics in market research cannot be overstated. With the abundance of data available today, businesses need to be able to make informed decisions quickly to stay ahead of the competition. Predictive analytics can help companies to identify trends, predict customer behaviour, and optimise pricing strategies. According to a survey by McKinsey & Company, companies that use predictive analytics are twice as likely to be in the top quartile of financial performance within their industry.

Stay ahead

Get regular insights

Keep up to date with the latest insights from our research as well as all our company news in our free monthly newsletter.

The Importance of Predictive Analytics in Market Research

The importance of predictive analytics in market research lies in its ability to provide businesses with the insights they need to make informed decisions and stay ahead of the competition. Brands can predict future behaviour and adjust their strategies by analyzing historical data and identifying patterns and trends.

One example of the power of predictive analytics is the case of Target, a large retail chain. Target analyzed its customers’ purchasing patterns and used that data to predict when customers were most likely to become pregnant. With this information, Target could send targeted advertisements and coupons to these customers, increasing sales and customer loyalty.

Another real-world example is how predictive analytics helped the Seattle Seahawks win the Super Bowl in 2014. The team used predictive analytics to analyze their opponents’ behaviour and tendencies, allowing them to make strategic decisions during the game. 

According to a study by Forbes Insights, businesses that use predictive analytics are more likely to experience improved customer engagement, increased profitability, and better overall business performance. 

Benefits of Predictive Analytics in Market Research

The benefits of predictive analytics in market research are numerous, and businesses that use this technique can gain valuable insights that can inform their decision-making process. According to a study by Harvard Business Review, businesses that use predictive analytics are more likely to experience increased revenue and profitability.

Here are some of the key benefits of using predictive analytics in market research:

  1. Improved accuracy in forecasting: Predictive analytics can help businesses forecast future trends and outcomes with a high degree of accuracy. This can help brands better plan their operations and resources to meet future demands. For example, a hotel chain can use predictive analytics to forecast room occupancy rates, allowing them to adjust staffing and inventory levels accordingly.
  2. Identifying trends: Predictive analytics can help businesses identify trends in customer behaviour, market conditions, and more. By identifying these trends, companies can adapt their strategies to meet changing market conditions. For example, a retail business can use predictive analytics to identify emerging customer purchasing behaviour trends, allowing it to adjust its inventory accordingly.
  3. Predicting customer behaviour: Predictive analytics can help businesses predict customer behaviour, such as buying patterns, preferences, and responses to marketing campaigns. This can help companies to tailor their marketing efforts and improve customer engagement. For example, an e-commerce business can use predictive analytics to identify customers who are most likely to make a purchase, allowing them to target these customers with personalised offers.
  4. Optimizing pricing strategies: Predictive analytics can help businesses optimise their pricing strategies by identifying the optimal price point for products and services. Using predictive analytics, brands can adjust their pricing strategies to maximise profits and stay competitive. For example, an airline can use predictive analytics to adjust ticket prices based on demand, maximizing revenue while ensuring seats are filled.

Use Cases of Predictive Analytics Around the World

Brands across the globe are increasingly using predictive analytics to gain insights into market trends and customer behaviour. Here are some examples of how businesses have used predictive analytics:

  • Tesco – a leading UK-based grocery retailer, used predictive analytics to identify the most profitable products and services for their customers. By analyzing customer data, Tesco was able to tailor its offerings to meet the specific needs of its customers, resulting in increased sales and customer loyalty.
  • Amazon – the world’s largest online retailer, uses predictive analytics to provide personalised recommendations to customers. By analyzing customer data, Amazon can recommend products and services most relevant to each customer, increasing sales and customer satisfaction.
  • Alibaba – one of China’s largest e-commerce companies, uses predictive analytics to identify products likely to be popular with customers. By analyzing search and purchase data, Alibaba can recommend products and services that are most likely to become successful, leading to increased sales and revenue.
  • Toyota – a leading automobile manufacturer, uses predictive analytics to identify the most profitable sales channels and to optimise pricing strategies. Toyota can adjust its pricing strategies by analyzing sales data to maximise profits and stay competitive.
  • Tokopedia – a leading e-commerce platform in Indonesia, uses predictive analytics to identify popular products and optimise pricing strategies. By analyzing customer data, Tokopedia can adjust its pricing strategies to meet customer demand, leading to increased sales and revenue.

These examples show how businesses in various countries leverage the power of predictive analytics in market research to achieve their goals, such as increasing sales, improving customer satisfaction, and staying ahead of the competition.

Challenges of Predictive Analytics

While predictive analytics can be a powerful tool for brands, it’s essential to understand the challenges associated with using this technique. 

According to a study by McKinsey & Company, many businesses struggle with these challenges when implementing predictive analytics. For example, the study found that only 19% of companies are very confident in the accuracy of their predictive models.

Here are some of the challenges of using predictive analytics in market research:

  • The need for large amounts of data: To accurately predict future outcomes and trends, businesses need large quantities of high-quality data. This can be a challenge for companies that don’t have access to the necessary data or that struggle with data quality issues.
  • Potential for biases in data analysis: Predictive analytics is only as good as the data used to train the models. If the data used to train the model is biased, the predictions made by the model will also be biased. For example, a predictive model that is trained using only data from a specific demographic may not accurately predict behaviour for other demographics.
  • Difficulty in interpreting results: Predictive analytics can provide businesses with a large amount of data and insights, but it can be challenging to interpret these results and turn them into actionable strategies. Companies need the necessary skills and expertise to interpret the data and make informed decisions.
  • Data privacy and security concerns: As businesses collect more data for predictive analytics, there are concerns about data privacy and security. Companies must comply with data protection regulations and take appropriate measures to secure their data.

As Dr. Michael Wu, Chief AI Strategist at PROS, said, “The biggest challenge in predictive analytics is not the algorithm, but the data.” To overcome the challenges of using predictive analytics in market research, businesses must invest in data quality and security and ensure they have the necessary skills and expertise to interpret the data and make informed decisions.

Best Practices for Implementing Predictive Analytics

To successfully implement predictive analytics, businesses must follow best practices to ensure they get the most out of this powerful tool. Here are some tips and best practices for companies looking to implement predictive analytics in their market research:

  1. Choose the right software tools: Many software tools are available for predictive analytics, and businesses must choose the one that best meets their needs. This can include tools that provide data visualisation, machine learning algorithms, and data cleaning and preprocessing.
  2. Ensure data quality: As discussed earlier, data quality is critical for accurate predictions. Businesses must ensure they have high-quality data, free from errors and biases. This can include data cleaning, normalisation, and validation.
  3. Involve domain experts: Domain experts, such as market research analysts, can provide valuable insights and context for the data used in predictive analytics. By involving these experts in the process, businesses can ensure that their predictions are relevant and actionable.
  4. Use historical data: Predictive analytics relies on historical data to make predictions about the future. Businesses need to have access to historical data, which should be relevant to the problem being addressed.
  5. Test and refine the model: Predictive models should be tested and refined to ensure accuracy and reliability. This can involve using different algorithms, adjusting parameters, and comparing the results to actual outcomes.
  6. Monitor and update the model: Predictive models should be monitored and updated over time to remain relevant and accurate. As market conditions change, the model may need to be updated to reflect these changes.

According to a study by the International Institute for Analytics, businesses that follow best practices for implementing predictive analytics are more likely to succeed. For example, the study found that brands involving domain experts in the process are more likely to see positive results.

By following these best practices, businesses can ensure they make the most of predictive analytics in their market research efforts.

In conclusion, predictive analytics is a powerful tool for businesses seeking insights into market trends and customer behaviour. Companies can use historical data and machine learning algorithms to predict future outcomes and adjust their strategies accordingly. However, there are challenges associated with using predictive analytics, such as the need for large amounts of high-quality data and the potential for biases in data analysis. 

To successfully implement predictive analytics in market research, businesses must follow best practices, such as choosing the right software tools and involving domain experts.

Kadence International, a market research agency, can help businesses navigate market research challenges and leverage the power of predictive analytics. With data collection, analysis, and interpretation expertise, we can provide valuable insights and help brands make data-driven decisions that lead to success. Contact us today to learn how we can help your business with market research.

Big data refers to the massive amount of structured and unstructured data generated by various sources in our digital world, such as social media, e-commerce transactions, and mobile devices. This data is characterised by its sheer volume, velocity, and variety, making it difficult to process using traditional methods.

“Big data will become the basis for competitive advantage, replacing the traditional competitive advantage of having the best resources, the best people, or the best strategy.” – Ginni Rometty, CEO of IBM.

The role of big data in market research is crucial in providing businesses with valuable insights into consumer behaviour, preferences, and market trends. Market researchers use big data to analyse consumer data and understand their purchasing habits, preferences, and opinions, which helps businesses make informed decisions about product development, marketing, and sales strategies.

Big data also helps identify potential market opportunities and challenges and understand the effectiveness of marketing campaigns. By leveraging advanced analytical techniques, such as machine learning and predictive analytics, market researchers can uncover patterns and relationships in consumer data, which can help businesses tailor their products and services to meet the needs and preferences of their target market.

The term “big data” was first popularised in the late 1990s and early 2000s, but the concept of handling large amounts of data dates back to much earlier. Here is a rough timeline of the history of big data:

Stay ahead

Get regular insights

Keep up to date with the latest insights from our research as well as all our company news in our free monthly newsletter.

The outlook for big data is very positive, with demand for big data solutions expected to continue growing as brands seek to harness the value of their data and make more informed decisions.

Here are some of the key trends and factors that are shaping the future of big data:

  • Continued Growth of Data: The amount of data being generated is continuing to grow at an exponential rate, driven by the proliferation of connected devices, the Internet of Things (IoT), and the rise of new technologies such as artificial intelligence and machine learning.
  • Wider Adoption of Cloud Computing: The trend towards cloud computing enables companies to store and process large amounts of data more efficiently and cost-effectively, driving the adoption of big data solutions.
  • Increased Focus on Data Privacy: As consumers become more aware of the value of their personal data, there is a growing demand for solutions that allow them to control and protect their information.
  • Advances in Artificial Intelligence and Machine Learning: The continued development of AI and machine learning makes it possible to extract more value from big data, enabling companies to gain new insights and make more informed decisions.
  • Expansion into New Industries: Big data is no longer limited to tech-focused industries and is increasingly being adopted by a wider range of industries, including healthcare, retail, finance, and energy.

4 Ways Big Data is Changing Market Research

As previously mentioned, big data refers to large and complex datasets generated by various sources, including social media, e-commerce transactions, and mobile devices. The sheer volume, velocity, and variety of big data can make it difficult to process and analyse using traditional data processing techniques.

“Big data is more than just a matter of size; it is an opportunity to find insights in new and emerging types of data and content, to make your business more agile, and to answer questions that were previously considered beyond your reach.” – Tim O’Reilly, Founder, and CEO of O’Reilly Media.

Big data is changing the way market research is conducted in several ways. First, big data allows market researchers to gain insights into consumer behaviour and preferences at a scale that was previously not possible. With big data, researchers can track consumer interactions across multiple touchpoints, including online and offline behaviours, social media interactions, and purchase history.

Second, big data enables market researchers to gain more accurate and in-depth insights into consumer behaviour and preferences. With traditional market research methods, such as surveys and focus groups, it can be difficult to get a complete picture of consumer behaviour and preferences, as the sample size is often limited and the data is self-reported. With big data, researchers have access to a much larger and more diverse dataset, which can provide a more accurate and in-depth view of consumer behaviour and preferences.

Third, big data allows market researchers to conduct research in real-time, providing brands with insights into consumer behaviour and preferences as they happen. This will enable companies to respond quickly to changing consumer preferences and needs and make more informed decisions.

Finally, big data enables market researchers to use more advanced analytical techniques, such as machine learning and artificial intelligence, to gain deeper insights into consumer behaviour and preferences. With these techniques, researchers can analyse large and complex datasets, uncover patterns and correlations, and gain insights into consumer behaviour and preferences in a way that was previously not possible.

In conclusion, big data is changing the way market research is conducted by providing researchers with access to larger and more diverse datasets, enabling real-time research, and allowing for more advanced analytical techniques. As a result, companies can gain more accurate and in-depth insights into consumer behaviour and preferences and make more informed decisions.

The Benefits of Big Data

The use of big data in market research offers several benefits that can help brands gain a better understanding of their customers and make more informed decisions. Some of the key benefits of big data in market research include the following:

  • Ability to gather and analyse vast amounts of data: One of the biggest benefits of big data in market research is the ability to gather and analyse vast amounts of data. With traditional market research methods, such as surveys and focus groups, it can be difficult to collect enough data to make accurate and informed decisions. However, with big data, researchers can gather and analyse vast amounts of data from a wide range of sources, including social media, e-commerce transactions, and mobile devices, providing a much more complete picture of consumer behaviour and preferences.
  • Real-time insights: Another key benefit of big data in market research is the ability to gain real-time insights. Traditional market research methods can take weeks or even months to gather and analyse data, by which time consumer preferences and behaviours may have changed. With big data, researchers can gain real-time insights into consumer behaviour and preferences, allowing companies to respond quickly to changes in the market.
  • Improved accuracy: Big data also provides a more accurate picture of consumer behaviour and preferences than traditional market research methods. With traditional methods, the sample size is often limited, and the data is self-reported, leading to biases and inaccuracies. With big data, researchers have access to a much larger and more diverse dataset, which can provide a more accurate view of consumer behaviour and preferences.
  • Advanced analytical techniques: Finally, big data enables market researchers to use more advanced analytical methods, such as machine learning and artificial intelligence, to gain deeper insights into consumer behaviour and preferences. These techniques can help researchers uncover patterns and correlations in large and complex datasets, giving organizations a more in-depth understanding of their customers.

The Power of Predictive Analytics

Predictive analytics is a key component of big data and is increasingly used by companies to make informed business decisions. Predictive analytics involves statistical models, machine learning algorithms, and other techniques to analyse large and complex datasets and predict future events or trends.

In market research, predictive analytics can forecast consumer behaviour and preferences and predict the success of marketing campaigns, product launches, and other initiatives. By leveraging the power of predictive analytics, brandss can better understand their customers, make more informed decisions, and stay ahead of the competition.

One of the key advantages of predictive analytics is its ability to identify patterns and correlations in large and complex datasets. This allows brands to predict future consumer behaviour and preferences and identify key drivers of consumer behaviour. For example, predictive analytics can identify the factors influencing consumer purchasing decisions, such as brand loyalty, price sensitivity, and product quality.

Another advantage of predictive analytics is its ability to provide real-time insights. Traditional market research methods can take weeks or even months to gather and analyse data, by which time consumer preferences and behaviours may have changed. With predictive analytics, organisations can gain real-time insights into consumer behaviour and preferences, allowing them to respond quickly to changes in the market.

The Challenges of Big Data

Despite the many benefits of big data in market research, several challenges are associated with this approach. Some of the main challenges of big data include the following:

  • The need for advanced data management systems: One of the biggest challenges of big data is the need for advanced data management systems. Traditional market research methods typically collect data in a centralised and structured format, making it easier to manage and analyse. However, with big data, data is often collected from a wide range of sources and in a variety of formats, making it more challenging to manage and analyse. As a result, companies must invest in advanced data management systems, such as data warehouses, data lakes, and cloud computing solutions, to effectively manage and analyse big data.
  • The need for skilled data scientists: Another challenge of big data is the need for qualified data scientists. With big data, organisations must analyse vast amounts of data using advanced techniques, such as machine learning and artificial intelligence, which require a high level of expertise. As a result, companies must invest in training and development programs for their data scientists or partner with external firms with the necessary expertise to effectively leverage the power of big data.
  • Data privacy and security concerns: With the increasing use of big data, there are also concerns about data privacy and security. With big data, organisations must collect and store vast amounts of personal data, which raises concerns about data privacy and security. As a result, companies must implement strong security measures and comply with data privacy regulations, such as the General Data Protection Regulation (GDPR), to protect personal data.
  • Quality and accuracy of data: Another challenge of big data is the quality and accuracy of data. With big data, organisations must rely on data from a wide range of sources, including social media, e-commerce transactions, and mobile devices, which may only sometimes be accurate or up-to-date. As a result, companies must validate and clean the data they collect to ensure its accuracy and quality.

Big Data Gone Wrong

There are several examples of big data gone wrong that are worth mentioning. One such example is the Cambridge Analytica scandal, where the data analytics firm gained unauthorised access to the personal data of millions of Facebook users, which was then used to influence political elections. This scandal brought attention to the potential misuse of big data and the importance of ethical considerations in its use.

“Big data is not about the data. It’s about creating insights, making informed decisions, and driving outcomes.” – Tom Davenport, Professor of Information Technology and Management at Babson College.

Another example is the concept of “fake news,” which has become increasingly prevalent with the rise of big data. The vast amounts of information available through big data can make it difficult to distinguish between credible and non-credible sources, leading to the spread of false information and misleading insights.

Finally, big data can also perpetuate existing biases and discrimination if the data used to inform decision-making is not diverse and representative. For example, facial recognition technology has faced criticism for having higher error rates for people with darker skin tones due to a lack of diverse training data.

These examples highlight the importance of responsible and ethical use of big data in market research and the need for companies to consider the potential consequences of their actions when leveraging big data to inform business decisions.

Integrating Big Data with Traditional Research Methods

While big data in market research offers many benefits, it is also essential to integrate it with traditional research methods, such as surveys and focus groups, to achieve a comprehensive understanding of consumer behaviour. This integration can help organisations:

  • Validate big data findings: By combining big data with traditional research methods, brands can validate the findings of big data and ensure the accuracy of their results. For example, by conducting surveys or focus groups, companies can gain insights into consumer attitudes and behaviours, which can be compared with the data collected from big data sources, such as social media or e-commerce transactions.
  • Gain deeper insights into consumer behaviour: Integrating big data with traditional research methods can also help organisations gain deeper insights into consumer behaviour. For example, by combining big data with focus groups, brands can gain a complete understanding of consumer attitudes and motivations, which can help them make more informed decisions.
  • Fill gaps in big data: Big data sources, such as social media and e-commerce transactions, only sometimes provide a complete picture of consumer behaviour. By integrating big data with traditional research methods, brands can fill gaps in their data and gain a full understanding of consumer behaviour.
  • Enhance the reliability of results: Integrating big data with traditional research methods can also enhance the reliability of market research results. By combining multiple data sources, organisations can gain a more accurate and comprehensive understanding of consumer behaviour.

The Role of Artificial Intelligence and Machine Learning

Artificial intelligence (AI) and machine learning (ML) are rapidly becoming an important part of big data in market research. These technologies are often used to automate the analysis of large amounts of data, making it easier and faster to gain insights into consumer behaviour. Some of the ways in which AI and ML are used in market research include:

  • Predictive modelling: AI and ML are used to create predictive models that can identify patterns and trends in big data. These models can be used to forecast consumer behaviour and make informed decisions.
  • Sentiment analysis: AI and ML can also be used to perform sentiment analysis on social media data, making it possible to gain insights into consumer opinions and attitudes.
  • Natural language processing: AI and ML are also used to perform natural language processing (NLP) on big data sources, such as customer reviews or surveys. NLP allows companies to analyse text data and gain insights into consumer behaviour.

In the future, AI technologies, such as ChatGPT, could play a significant role in market research. For example, ChatGPT could conduct virtual focus groups or customer interviews. This type of AI could provide a more natural and interactive experience for participants, making it easier to gain insights into consumer behaviour. Additionally, ChatGPT could automate customer feedback analysis, making it possible to gain insights into consumer behaviour in real-time.

Best Practices for Big Data Market Research

When conducting big data market research, it is essential to follow best practices to ensure the quality and accuracy of the data. Some of the best practices for big data market research include:

  • Focus on data quality: The quality of the data is critical for making informed decisions. Organisations should focus on collecting high-quality data from reliable sources, such as customer surveys or transactional data. Additionally, it is essential to clean and validate the data to ensure accuracy.
  • Ethical considerations: Big data market research raises significant ethical concerns like privacy and data security. Brands should be transparent about their data collection practices and obtain consent from participants. Additionally, it is crucial to secure and store data to protect sensitive information properly.
  • Integration with traditional research methods: While big data provides valuable insights into consumer behaviour, it is important also to integrate it with traditional research methods, such as focus groups or customer interviews, to gain a comprehensive understanding of consumer behaviour.
  • Data management and storage: The volume and complexity of big data requires advanced data management systems and storage solutions. Brands should invest in these technologies to ensure that they can efficiently store, manage, and analyse large amounts of data.
  • Collaboration with data scientists: Organisations may need to collaborate with data scientists or other experts to analyse the data and extract insights. It is vital to work with experienced professionals to ensure that the data is analysed accurately and effectively.

Big Data in Action

Big data has been used in various industries to inform business decisions and improve market research. Here are a few examples:

  • Retail: Big data has been used by retailers to analyse customer purchase patterns and improve inventory management. For example, retailers can use data on customer purchases to determine which products are in high demand and adjust their inventory accordingly.
  • Healthcare: The healthcare industry uses big data to improve patient outcomes and reduce costs. For example, healthcare providers use patient health records and medical procedures data to identify trends and make treatment recommendations.
  • Finance: Financial services companies use big data to improve risk management and fraud detection. For example, banks can use data on customer transactions to identify unusual patterns that may indicate fraudulent activity.
  • Marketing: Marketers use big data to gain insights into consumer behaviour and target advertisements more effectively. For example, companies can analyse consumer searches and social media activity data to determine which products and services interest consumers.

These are just a few examples of how big data can inform business decisions and improve market research. As technology evolves and the amount of data generated continues to grow, we will likely see even more innovative uses of big data in the future.

Final thoughts and Key Takeaways

It is worth mentioning that the role of big data in market research is constantly evolving. As technology advances and the amount of data generated continues to grow, the opportunities to leverage big data in market research are only increasing.

“Big data, if used correctly, has the potential to change the face of market research forever. By harnessing the power of advanced analytics, market researchers can uncover new insights and trends that were previously hidden in the data.” – Raj De Datta, CEO and Co-Founder of Bloomreach.

One key trend in using big data for market research is the rise of omnichannel data. Omnichannel data refers to collecting data from various sources, including online and offline interactions, to understand consumer behaviour comprehensively. With the rise of the Internet of Things (IoT) and the increasing use of mobile devices, the amount of omnichannel data available for analysis is snowballing.

Another trend in using big data for market research is the increased focus on data privacy and ethics. With the growing amount of data being collected and analysed, companies must ensure that they respect consumers’ privacy and adhere to ethical standards.

Key Takeaways

  • Big data refers to the vast amounts of structured and unstructured data generated by modern technologies, such as social media, online transactions, and IoT devices.
  • The benefits of using big data in market research include gathering and analysing vast amounts of data in real-time, gaining deeper insights into consumer behaviour, and making more informed business decisions.
  • Predictive analytics is a powerful tool in big data, as it can help brands identify trends and predict future behaviour.
  • The use of big data in market research is not without its challenges, including the need for advanced data management systems, skilled data scientists, and ethical considerations.
  • Integrating big data with traditional research methods, such as surveys and focus groups, can provide a comprehensive understanding of consumer behaviour and help companies make more informed decisions.
  • AI and machine learning play a significant role in big data, as they can help process and analyse vast amounts of data and improve market research.
  • Best practices for conducting big data market research include ensuring data quality, considering ethical considerations, and integrating big data with traditional research methods.
  • Real-life examples of big data in action include its use in personalised marketing, identifying consumer trends, and predicting future behaviour.
  • Despite the potential benefits of big data in market research, there are also possible consequences, including spreading false information, perpetuating existing biases and discrimination, and potential misuse of data. As such, market researchers must be aware of these potential consequences and ensure that they use big data in an ethical and responsible manner.

In conclusion, big data has already significantly impacted market research and is only becoming more important as technology advances, and the amount of data generated continues to grow. Market researchers who embrace big data and understand its potential benefits and challenges will be well-positioned to succeed in the future.

Imagine this: You’re scrolling through your social media feed and come across a product ad that catches your attention. The ad tells a story that speaks to your heart, making you want to learn more about the product and even consider buying it. This is the power of storytelling in product marketing.

In today’s crowded marketplace, it’s becoming increasingly difficult for brands to stand out and connect with their target audience. Storytelling provides a way for companies to create a lasting emotional connection with their customers by tapping into their hopes, fears, and desires.

Many companies and brands have successfully used storytelling in their product marketing. Take Nike, for example, whose “Just Do It” campaign tells stories of athletes overcoming challenges to achieve greatness. 

And there’s Coca-Cola, whose “Share a Coke” campaign tells the story of a simple act of sharing a Coke with friends and family, highlighting the brand’s values of happiness and togetherness.

But how can companies effectively use storytelling in their product marketing? In this article, we will explore the art of storytelling in product marketing, providing tips and guidance on creating compelling brand stories that engage customers and drive sales. We will also discuss the importance of understanding your audience, choosing the right channels for sharing your story and measuring the success of your storytelling efforts. So, let’s get started and discover the art of storytelling in product marketing.

The Power of Storytelling

In the world of marketing, storytelling is a powerful tool that brands can use to connect with their customers on a deeper, emotional level. By telling relatable and inspiring stories, companies can create a connection with their audience that goes beyond the product or service they offer.

Successful companies understand the value of storytelling. Apple’s “Think Different” campaign tells the story of how it differs from other technology companies, highlighting its innovation and creativity. This story inspires customers to see themselves as part of a community of people who are also “different.”

Dove’s “Real Beauty” campaign tells the story of how women should embrace their natural beauty. The campaign uses real women with diverse body types and skin tones and focuses on their stories and struggles. This story resonated with customers and helped Dove become a leader in the beauty industry.

Storytelling is a powerful tool in product marketing because it evoles emotions, connects with customers on a deeper level.

To quote Maya Angelou, “I’ve learned that people will forget what you said, people will forget what you did, but people will never forget how you made them feel.” This is the essence of storytelling in product marketing: create an emotional connection with customers that lasts beyond the transaction.

Understanding Your Audience

To create a compelling brand story, it’s crucial to understand your target audience and their needs and interests. This knowledge allows you to tailor your storytelling to resonate with them and create a strong emotional connection.

Customers are looking for brands that align with their values and beliefs. They are more likely to engage with content that speaks to those values. A great example of this is TOMS Shoes, a company that donates a pair of shoes to someone in need for every pair purchased. TOMS promotes its ethos and tells a story of social responsibility and giving back. This story resonates with customers who value social impact and has helped TOMS become a leader in the ethical fashion industry.

Another example is Airbnb, a company that tells the story of “belonging anywhere.” The brand’s storytelling focuses on the unique and authentic experiences that customers can have when they use Airbnb, catering to the needs and interests of travellers who seek immersive and personalised travel experiences.

To understand your target audience and their needs and interests, it’s important to gather data and insights about their demographics, psychographics, and behaviours. This information can be collected through market research, customer surveys, and social media analytics.

Once you deeply understand your target audience, you can tailor your storytelling to meet their needs and interests. This can include incorporating their values and beliefs, using language and visuals that resonate with them, and telling relatable and inspiring stories.

Stay ahead

Get regular insights

Keep up to date with the latest insights from our research as well as all our company news in our free monthly newsletter.

Creating Your Story

Creating a compelling brand story is an art that requires careful planning and execution. A strong brand story can engage customers, create an emotional connection, and differentiate your brand from competitors.

Here are some tips and guidance on how to create a compelling brand story:

Develop a relatable character 

Your story’s protagonist should be someone your target audience can relate to. This character should have struggles and challenges that they can identify with.

For example, the clothing brand Patagonia tells the story of Yvon Chouinard, the company’s founder, as a relatable character who embodies the brand’s values of sustainability and environmentalism.

Create conflict

A compelling story needs conflict to create tension and keep the audience engaged. This conflict could be anything from a problem your target audience faces to a challenge your company overcame.

The shoe company Allbirds tells the story of how they discovered a sustainable material to make their shoes, overcoming the challenge of finding an environmentally-friendly option in the fashion industry.

Provide a resolution

A resolution is the story’s conclusion, where the conflict is resolved. This resolution should satisfy the audience and reinforce your brand’s values.

The car company Volvo tells the story of how their cars prioritise safety, resolving the conflict of fear and danger on the road.

Use visuals and language

Your language and visuals should be consistent with your brand’s values and personality. This includes everything from the tone of your language to the colours and imagery you use.

The makeup brand Glossier uses playful and colourful imagery in its storytelling to reflect the brand’s personality and appeal to a younger demographic.

Choosing Your Channels

Once you’ve developed a compelling brand story, it’s time to share it with the world. Choosing the right channels for sharing your story can help you reach your target audience and create a lasting impact. 

Here are some of the channels you can use to share your brand story:

Social media

Social media platforms such as Facebook, Instagram, TikTok and Twitter are great for sharing visual and engaging content. According to Hootsuite, social media users spend an average of 2 hours and 24 minutes per day on social media. This presents a huge opportunity for brands to connect with their target audience and share their brand story.

The sportswear brand Lululemon uses Instagram to showcase their products and tell the story of their brand’s values and lifestyle. They also use influencer partnerships and user-generated content to create a community around their brand.

Email marketing

Email marketing is an effective way to reach customers directly and share your brand story.

According to Hubspot, email marketing has an average ROI of 38:1, making it a highly effective marketing channel.

The cosmetics company Sephora uses email marketing to share its brand story and promote its products. They send personalised emails based on customers’ purchase history and preferences, using language and visuals that resonate with their target audience.

Content marketing

Content marketing involves creating valuable, educational content that provides value to your target audience. This content can be shared on your website, blog, or social media platforms.

The furniture retailer West Elm uses content marketing to educate customers on interior design trends and share their brand story. They create blog posts and social media content that features their products in real-life settings and offers design tips and inspiration.

Measuring Success

Measuring the success of your storytelling efforts is essential to understand the impact of your brand story on your target audience. 

By tracking metrics such as engagement, conversions, and sales, you can evaluate the effectiveness of your storytelling and optimise your strategy accordingly.

Here are some metrics you can use to measure the success of your storytelling efforts:

Engagement

Engagement metrics include likes, comments, shares, and followers on social media platforms. These metrics can help you understand how well your target audience connects with your brand story.

Conversions

Conversions refer to your target audience’s actions after engaging with your brand story. This can include signing up for a newsletter, downloading a resource, or making a purchase.

Sales

Sales metrics include revenue, order value, and customer retention. By tracking these metrics, you can understand the direct impact of your brand story on your bottom line.

The role of Market Research and Storytelling

Market research is crucial in creating a compelling brand story that resonates with your target audience. By understanding your target audience’s needs, preferences, and pain points, you can create a brand story that is relatable and engaging.

Here are some ways that market research can help product marketers create a compelling story for their product:

Identify customer pain points

Market research can help you identify your target audience’s problems and pain points. By understanding their challenges, you can create a brand story that addresses these issues and provides solutions.

Determine brand values

Market research can help you identify the values and beliefs that your target audience cares about. By incorporating these values into your brand story, you can create an emotional connection with your audience.

Test messaging

Market research can help you test different messaging and brand story concepts with your target audience. By getting feedback from your audience, you can optimise your brand story and ensure that it resonates with your customers.

Storytelling is a powerful tool that product marketers can use to create a lasting emotional connection with their customers. By tapping into their hopes, fears, and desires, companies can tell compelling brand stories that engage customers and drive sales.

As competition in the marketplace continues to grow, the brands that can tell a compelling brand story will be the ones that stand out and succeed. 

In today’s highly competitive business environment, brands must have a well-informed and effective product marketing strategy. One of the key ways to achieve this is by using data-driven insights to inform decision-making and guide marketing efforts. With the vast amounts of data available, it’s possible to gain a deep understanding of your target audience, track the success of your marketing efforts, optimise your marketing mix, personalise your marketing approach, and stay ahead of the competition.

A recent study found that companies that use data-driven insights to inform their product marketing strategies are 2-3 times more likely to report significant revenue growth than companies that do not. By leveraging data-driven insights, companies can make informed decisions about their product marketing strategies and achieve better results. For example, data can help companies understand their target audience’s preferences and behaviours, shaping the messaging and offers used in marketing campaigns. Data can also help companies track the performance of their marketing efforts, allowing them to make adjustments and improvements as needed.

This blog will explore how companies can use data-driven insights to improve their product marketing strategies and achieve better results.

Stay ahead

Get regular insights

Keep up to date with the latest insights from our research as well as all our company news in our free monthly newsletter.

Understanding Your Target Audience

One of the key aspects of a successful product marketing strategy is understanding your target audience. By gaining insights into their preferences, behaviours, and pain points, you can tailor your marketing efforts to meet their needs better and drive better results. There are several ways to use data to gain these insights, including:

  • Customer Surveys: Conducting customer surveys is a great way to gather information about your target audience’s preferences and behaviours. This can include their buying habits, product usage, and pain points.
  • Web Analytics: Web analytics tools, such as Google Analytics, can provide valuable insights into your target audience’s online behaviours, such as the pages they visit, the time they spend on your site, and the devices they use to access your site.
  • Social Media Analytics: Social media platforms, such as Facebook and Twitter, offer built-in analytics tools that can help you understand your target audience’s preferences and behaviours on these platforms.
  • Customer Interviews: Conducting customer interviews can provide valuable insights into your target audience’s pain points and preferences. This can include insights into what they like, dislike, and want in a product.

Using these and other data sources, you can gain a deep understanding of your target audience and use that information to inform your product marketing strategy. This can include the messaging and offers you use in marketing campaigns, the channels you use to reach your target audience, and the products and services you offer. Understanding your target audience can create a more effective product marketing strategy that resonates with them and drives better results.

Measuring the Success of Your Marketing Efforts

To effectively improve your product marketing strategy, it’s essential to track the performance of your marketing efforts. This allows you to understand what’s working well and what needs improvement, so you can make data-driven decisions and achieve better results. There are several key metrics to track, including:

  • Website Traffic: Tracking website traffic is a good indicator of the overall reach of your marketing efforts. You can track the number of visitors to your site, the pages they visit, and the time they spend on your site.
  • Conversion Rates: Conversion rates measure the percentage of website visitors who take a desired action, such as making a purchase or filling out a form. This metric is important because it indicates how effectively your marketing efforts drive results.
  • Customer Engagement: Customer engagement metrics, such as likes, shares, and comments, can provide valuable insights into how your target audience interacts with your marketing efforts. This information can inform future marketing campaigns and improve customer engagement.
  • Return on Investment (ROI): ROI is a key metric that measures the return on your marketing investment. This metric can determine the effectiveness of your marketing efforts and make data-driven decisions about where to allocate resources in the future.

By tracking these and other metrics, you can better understand the performance of your marketing efforts and make data-driven decisions to improve your product marketing strategy. This can lead to increased customer engagement, higher conversion rates, and improved bottom-line results.

Optimising Your Marketing Mix

One of the key benefits of using data-driven insights to inform your product marketing strategy is the ability to optimise your marketing mix. This includes optimising the channels, messaging, and offers used in marketing campaigns. Using data to inform these decisions, you can achieve better results and create a more effective marketing mix. Here are some ways to use data to optimise your marketing mix:

  • Channels: Data can help you understand which channels are most effective at reaching your target audience and driving results. This can include information about the type of content that resonates best with your target audience on each channel and the times when they are most active.
  • Messaging: Data can inform the messaging used in marketing campaigns by providing insights into your target audience’s pain points and preferences. This can help you create messages that are more relevant and effective.
  • Offers: Data can inform the offers used in marketing campaigns by providing insights into the type of offers most appealing to your target audience. This can include information about discounts, promotions, and other incentives that drive the best results.

Using data to inform these decisions, you can create a marketing mix tailored to your target audience’s needs and preferences and drive better results. This can include increased customer engagement, higher conversion rates, and improved bottom-line results. You can stay ahead of the competition by continuously monitoring and optimizing your marketing mix and achieve long-term success.

Personalising Your Marketing Approach

Personalisation is becoming increasingly important in product marketing, as customers expect to receive relevant and tailored experiences. 

Using data to personalise your marketing approach, you can create more effective marketing campaigns that resonate with individual customers. According to a survey by Epsilon, personalisation can increase email open rates by 26% and click-through rates by 14%.

Here are some ways to use data to personalise your marketing approach:

  1. Customer Segmentation: Data can be used to segment your customer base into different groups based on common characteristics, such as demographics, behaviours, and preferences. This information helps create targeted marketing campaigns for each segment.
  2. Behavioural Tracking: Behavioral tracking can provide valuable insights into the actions and preferences of individual customers. This information is invaluable in helping to personalise marketing messages and offers, such as recommendations based on past purchases.
  3. Dynamic Content: Dynamic content technology can deliver personalised experiences to individual customers based on their behaviours and preferences. For example, you can use data to show different images or messaging to different customers based on their interests.

Using data to personalise your marketing approach, you can create more relevant and effective marketing campaigns that drive better results. Personalisation can lead to increased customer engagement, higher conversion rates, and improved customer satisfaction, ultimately resulting in improved bottom-line results.

Staying Ahead of the Competition

In today’s highly competitive business environment, staying ahead of your competition and staying up-to-date on industry trends and best practices is essential. You can gain a competitive advantage and create a more effective product marketing strategy using data-driven insights. Here are some ways to use data to stay ahead of the competition:

  • Competitive Analysis: Data can be used to analyze your competitors’ marketing strategies, including their channels, messaging and offers. This information can inform your marketing strategy and stay ahead of the competition.
  • Industry Trends: Data can be used to stay up-to-date on the latest industry trends and best practices. This can include information about emerging technologies, consumer behaviours, and marketing techniques.
  • Customer Feedback: Customer feedback is a valuable data source that can shape your product marketing strategy. Using customer feedback data, you can stay ahead of the competition by understanding what customers want and need and continuously improving your offerings.

By using data-driven insights to stay ahead of the competition and stay up-to-date on industry trends and best practices, you can create a more effective product marketing strategy that drives better results. This can lead to increased customer engagement, higher conversion rates, and improved bottom-line results.

Conducting Effective Market Research

Market research is vital for informing product marketing strategies and making data-driven decisions. By conducting market research, companies can gain valuable insights into their target audience and industry trends, helping to shape their product marketing strategies and achieve better results.

Defining Your Research Objectives:

The first step in conducting effective market research is to define your research objectives. This involves identifying the questions you want to answer through market research and prioritizing them based on their importance to your business. For example, you may want to understand the needs and preferences of your target audience or stay up-to-date on the latest industry trends. By defining your research objectives, you can ensure that your market research is focused and effective.

Choosing the Right Research Method:

Once you have defined your research objectives, the next step is to choose the right research method. There are several market research methods, including surveys, focus groups, and customer interviews. The best approach for your research objectives will depend on the type of information you are trying to gather and the resources available to you. For example, customer interviews may be the best method for gaining deep insights into customer pain points, while surveys may be the best method for gathering large amounts of data.

Analyzing and Interpreting Your Data:

Once you have collected your data, the next step is to analyze and interpret it. This involves looking for patterns and trends in the data and using those insights to inform your product marketing strategy. There are several tools and techniques that can be used to analyze and interpret market research data, including statistical analysis, data visualisation, and machine learning algorithms.

Communicating Your Findings:

Once you have analyzed and interpreted your market research data, the next step is communicating your findings to stakeholders. This can include senior management, marketing teams, and other departments involved in product marketing. To effectively communicate your findings, you must present the data clearly and compellingly, using visual aids such as charts, infographics, graphs, or even video to help illustrate your points.

Incorporating Your Findings into Your Marketing Strategy:

The final step in conducting effective market research is incorporating your findings into your product marketing strategy. This involves using the insights from your market research to inform your product marketing strategy and make data-driven decisions. For example, you may use your market research findings to create more targeted marketing campaigns or to develop new products and services that better meet the needs of your target audience.

Data-driven insights are becoming increasingly important in product marketing as companies seek ways to reach their target audience and drive better results. By using data to understand your target audience, measure the success of your marketing efforts, optimise your marketing mix, personalise your marketing approach, and stay ahead of the competition, you can create a more effective product marketing strategy. Additionally, conducting effective market research can provide valuable insights into your target audience and industry trends, helping you to make data-driven decisions and achieve better results.

In market research, the collection and use of data raise several ethical considerations, such as obtaining informed consent, protecting the privacy and confidentiality of participants, avoiding deceptive practices, and ensuring data accuracy. 

Ethical guidelines, such as the International Chamber of Commerce’s ICC/ESOMAR International Code on Market and Social Research, provide a framework for conducting market research responsibly and respectfully. Additionally, industry-specific regulations, such as the General Data Protection Regulation (GDPR) in the European Union, further regulate the collection and use of personal data. Brands and their market research teams must be aware of these ethical considerations and guidelines to ensure the validity and credibility of their research findings and maintain the trust of their participants.

The Importance of Ethical Data Collection

The ethics of data collection play a crucial role in the credibility and validity of market research findings. When data is collected ethically, participants can trust that their personal information is handled responsibly and securely. 

This trust is essential for accurate research results, as participants are more likely to provide honest and complete answers when they feel their privacy and confidentiality are protected.

“The right to privacy is a fundamental human right, essential for the protection of human dignity and autonomy.” – Justice Michael Kirby.

Additionally, ethical data collection practices help to maintain the reputation and credibility of the market research industry. Deceptive or unethical practices can damage the reputation of both the individual researcher and the industry as a whole, leading to a loss of trust from participants, clients, and stakeholders.

It is also a legal obligation for researchers to adhere to ethical standards and regulations, such as the GDPR. Failing to comply with these regulations can result in significant fines and legal consequences, damaging the reputation of the research company and potentially impacting its ability to conduct research in the future.

Stay ahead

Get regular insights

Keep up to date with the latest insights from our research as well as all our company news in our free monthly newsletter.

Data Privacy Laws Around the World

Data privacy laws vary by country, but here is an overview of some of the most notable data privacy laws in different regions worldwide.

It is important to note that these laws are subject to change and that organisations should stay informed about their regions’ latest data privacy laws and regulations.

UK: The General Data Protection Regulation (GDPR) applies to organisations operating in the EU, including the UK. The GDPR requires organisations to obtain explicit consent from individuals before collecting and processing their personal data.

Europe: The General Data Protection Regulation (GDPR) applies to organisations operating in the EU. It sets out strict rules for collecting and processing personal data, including the right to erasure and data portability.

USA: The United States does not have a comprehensive federal data privacy law, but some states have enacted their own privacy laws, such as the California Consumer Privacy Act.

Canada: The Personal Information Protection and Electronic Documents Act (PIPEDA) governs the collection, use, and disclosure of personal data in Canada. Organisations must obtain explicit consent before collecting personal data and must protect the privacy of the data they collect.

Thailand: The Personal Data Protection Act (PDPA) became effective in May 2020 and governed the collection, use, and disclosure of personal data in Thailand. Organisations must obtain explicit consent before collecting personal data and must protect the privacy of the data they collect.

Philippines: The Data Privacy Act of 2012 governs the collection, use, and disclosure of personal data in the Philippines. Organisations must obtain explicit consent before collecting personal data and must protect the privacy of the data they collect.

Japan: The Act on the Protection of Personal Information governs the collection, use, and disclosure of personal data in Japan. Organisations must obtain explicit consent before collecting personal data and must protect the privacy of the data they collect.

Indonesia: The Personal Data Protection Law governs the collection, use, and disclosure of personal data in Indonesia. Organisations must obtain explicit consent before collecting personal data and must protect the privacy of the data they collect.

China: The Cybersecurity Law of the People’s Republic of China governs the collection, use, and disclosure of personal data in China. Organisations must obtain explicit consent before collecting personal data and must protect the privacy of the data they collect.

Singapore: The Personal Data Protection Act (PDPA) governs the collection, use, and disclosure of personal data in Singapore. Organisations must obtain explicit consent before collecting personal data and must protect the privacy of the data they collect.

India: The Personal Data Protection Bill, 2019, governs the collection, use, and disclosure of personal data in India. The bill requires organisations to obtain explicit consent before collecting personal data and to protect the privacy of the data they collect.

Vietnam: The Personal Data Protection Law governs the collection, use, and disclosure of personal data in Vietnam. Organisations must obtain explicit consent before collecting personal data and must protect the privacy of the data they collect.

Examples of Brands Fined for Violating Data Privacy

These are just a few examples of the many brands that have faced fines for violating data privacy laws. It is essential for companies to take data privacy seriously and to comply with the relevant laws and regulations to avoid similar consequences.

  1. Google was fined €50 million by the French data protection authority (CNIL) in January 2019 for violating the General Data Protection Regulation (GDPR).
  2. Facebook was fined $5 billion by the Federal Trade Commission (FTC) in July 2019 for violating its users’ privacy rights.
  3. Marriott International was fined £18.4 million by the Information Commissioner’s Office (ICO) in July 2019 for a data breach affecting approximately 339 million guests.
  4. British Airways was fined £20 million by the ICO in July 2019 for a data breach affecting approximately 500,000 customers.
  5. Equifax was fined £500,000 by the ICO in September 2018 for a data breach affecting approximately 15 million UK citizens.

The Ethics of Data Privacy

Data privacy is a critical aspect of ethical data collection in market research. The personal information of participants must be protected and kept confidential to maintain their trust in the research process and to prevent potential harm or abuse of their data.

One of the key ethical considerations in protecting consumer data privacy is obtaining informed consent. Participants must be fully informed about how their data will be collected, used, and stored, and they must give explicit consent for their information to be used in the research. This includes informing participants who will have access to their data, for what purposes it will be used, and for how long it will be stored.

“Data is the new oil, but privacy is the new gasoline.” – Unknown.

Another important consideration is data security. Market researchers must implement appropriate measures to secure the collected data, such as encryption and secure storage solutions, to prevent unauthorised access and to protect participants’ information from theft or breaches.

It is essential for market researchers to be transparent and honest about their data collection practices. Deceptive or misleading practices, such as collecting data without obtaining proper consent or using data for purposes outside of what was initially disclosed, can severely damage the trust of participants and harm the reputation of the market research industry.

The concept of data privacy has been a concern for individuals and organisations for many decades. Still, it has become increasingly relevant in recent years with the rapid growth of technology and the increasing amount of personal data collected and stored by organisations. Here is a timeline of some key events related to data privacy and notable data breaches by year:

  • 1970s: The first privacy laws, such as the US Privacy Act of 1974, are enacted in response to government data collection and storage concerns.
  • 1980s: The first computer viruses were discovered, and the threat of data breaches became more prominent.
  • 1990s: The rise of the internet and the increasing use of personal computers leads to concerns about online data privacy.
  • 2000s: The growth of social media and the increasing amount of personal data collected by organisations leads to increased privacy concerns.
  • 2005: The first large-scale data breach, involving the theft of millions of credit card numbers by one of the largest credit card processors in the United States, CardSystems Solutions, is reported. The breach was one of the first large-scale data breaches to receive widespread media attention and raised concerns about the security of personal data stored by organisations. The breach resulted in the loss of credit card information for 40 million individuals and prompted a number of major credit card companies to reissue their customers’ credit cards. The breach also led to increased scrutiny of data security practices by organisations and a call for stronger data privacy laws to protect consumers.
  • 2013: The first high-profile data breach involving the unauthorised access of personal data, such as names, addresses, and social security numbers, is reported. Hackers stole 40 million credit card numbers and 70 million other pieces of information, such as names, addresses, and phone numbers, from the retailer’s database. The breach was one of the largest data breaches to date and resulted in widespread media coverage and concern about the security of personal information stored by organisations. The breach also increased scrutiny of data security practices and calls for more robust data privacy laws to better protect consumers. This event highlighted the need for organisations to take data privacy and security seriously, implement strong security measures, and regularly review and update their practices to stay ahead of evolving threats.
  • 2018: The European Union’s General Data Protection Regulation (GDPR) goes into effect, setting new standards for data privacy and security in Europe.
  • 2019: The Capital One data breach, involving the theft of personal data of over 100 million individuals, is reported.
  • 2020: The Zoom video conferencing platform becomes widely used due to the COVID-19 pandemic, leading to concerns about the security of personal data being transmitted over the platform.

The Ethics of Data Use

The use of collected data is just as important as the collection process in terms of ethical considerations. Market researchers are responsible for using the data they collect in a manner that is respectful, non-discriminatory, and in line with the initial purpose for which it was collected.

One key consideration is avoiding discriminatory practices. Market research data must not be used to make decisions that unfairly impact or discriminate against particular groups based on race, gender, religion, or sexual orientation. Researchers must also ensure that their findings are not used to perpetuate negative stereotypes or to support biased viewpoints.

“Ethics is knowing the difference between what you have a right to do and what is right to do.” – Potter Stewart.

Another important consideration is maintaining the confidentiality of participants’ information. Researchers must not use collected data in a manner that violates participants’ privacy, such as by sharing it with third parties without proper consent. The data must be used only for the purposes for which it was collected and must be kept confidential to the extent required by law or ethical guidelines.

The Importance of Consent

Obtaining informed consent from consumers is crucial to ethical data collection in market research. It is essential for market researchers to respect the privacy rights of participants and to ensure that they fully understand how their data will be used and what they agree to when they provide it.

Informed consent means that participants clearly understand the purpose of the research, how their data will be collected, used, and stored, and the consequences of participating or not participating in the research. Participants must also be allowed to opt-out of the research or withdraw their consent at any time.

When participants provide their informed consent, it demonstrates their trust in the market research process and their willingness to participate. This trust is essential for accurate research results, as participants are more likely to provide honest and complete answers when they feel their privacy and confidentiality are protected.

However, obtaining informed consent also protects the rights of participants and ensures that their data is not being collected or used without their knowledge or permission. Market researchers must be transparent and honest about data collection and use practices to build trust and credibility with their participants.

Data Security and Protection

Data security and protection are crucial components of ethical data collection in market research. Market researchers are responsible for implementing appropriate measures to secure the collected data and prevent unauthorised access, theft, or breaches.

One key consideration is using secure storage solutions, such as encrypted databases, to store collected data. This helps to prevent unauthorised access to the data and to ensure that it is protected from potential breaches.

Another critical consideration is controlling access to the collected data. Market researchers must limit access to the data to only those who need it. They must have appropriate security measures, such as password protection, to prevent unauthorised access.

Additionally, market researchers must have procedures in place to detect and respond to data breaches if they occur. This includes regular monitoring of the security of collected data and having a plan to quickly address any breaches and take appropriate action to prevent future violations.

The Role of Industry Regulations

Industry regulations play a significant role in shaping the ethics of data collection in market research. Regulations such as the General Data Protection Regulation (GDPR) in the European Union and similar laws in other regions set standards for the collection, use, and storage of personal data and provide guidelines for protecting the privacy rights of individuals.

Market researchers must comply with these regulations and follow the established guidelines to ensure that their data collection practices are ethical and in line with the law. This includes obtaining informed consent from participants, protecting the privacy of collected data, and ensuring that data is not used in a discriminatory manner.

Industry regulations also set data security and protection standards, requiring market researchers to implement appropriate measures to secure collected data and prevent breaches. These regulations also give individuals the right to access their personal data and to request that it be deleted or corrected if it is inaccurate.

Ethical Considerations in the Use of Big Data

The use of big data in market research presents several ethical considerations, including data bias and algorithmic transparency. Market researchers must be aware of these considerations and take steps to ensure that their use of big data is ethical and in line with industry regulations.

Data bias refers to the inherent biases that exist in data sets, which can result in inaccurate or skewed results if not properly addressed. For example, suppose a data set used in market research predominantly consists of data from one demographic group. In that case, it may not accurately represent the experiences or opinions of other groups.

To address data bias, market researchers must be aware of their data sources and take steps to ensure that their data sets are representative and diverse. This may include sourcing data from multiple sources and using techniques such as oversampling to increase the representation of underrepresented groups.

Algorithmic transparency is another important consideration in using big data in market research. Algorithms used to analyze data can contain biases and make decisions that are not transparent or easily understood. To address this issue, market researchers must ensure that the algorithms they use are transparent and can be audited and that the decisions made by algorithms are easily explainable and free from bias.

Best Practices for Ethical Data Collection

Best practices for ethical data collection in market research include:

  • Having a clear privacy policy.
  • Obtaining informed consent.
  • Implementing appropriate data security measures.

By following these best practices, market researchers can ensure that their data collection practices are ethical, respectful of participants’ privacy rights, and in line with industry regulations.

Having a clear privacy policy is essential for ethical data collection. This policy should outline the type of data that will be collected, how it will be used, and who will have access to it. Participants should be able to understand the privacy policy easily and have the option to opt-out of data collection if they choose.

Obtaining informed consent is another key best practice for ethical data collection. Market researchers must inform participants about the data that will be collected and how it will be used and obtain their explicit consent before collecting any data. Participants should also have the option to withdraw their consent at any time.

Data security is also essential for ethical data collection. Market researchers must implement appropriate measures to secure collected data, such as encryption and secure storage, and take steps to prevent breaches and unauthorised access.

Checklist of Best Practices for Ethical Data Collection

By following this checklist of best practices for ethical data collection, market researchers can ensure that their data collection practices are responsible, honest, and in line with industry standards.

  1. Develop a clear privacy policy: Outline the data collection type, how it will be used, and who will have access to it.
  2. Obtain informed consent: Inform participants about the data that will be collected and how it will be used, and obtain their explicit consent before collecting any data.
  3. Implement data security measures: Encrypt collected data and store it securely to prevent breaches and unauthorised access.
  4. Respect the right to privacy: Allow participants to opt-out of data collection and allow them to withdraw their consent at any time.
  5. Avoid discriminatory practices: Ensure that collected data is used ethically and avoid discriminatory practices.
  6. Comply with industry regulations: Stay informed about industry regulations, such as GDPR, and ensure that your data collection practices align with these regulations.
  7. Consider the ethics of big data: Be aware of ethical considerations related to the use of big data, such as data bias and algorithmic transparency.
  8. Maintain transparency: Be transparent about your data collection practices and clearly communicate your privacy policy to participants.
  9. Conduct regular review: Regularly review your data collection practices to ensure that they are ethical and in line with industry standards.
  10. Educate yourself and your team: Stay informed about best practices for ethical data collection and educate yourself and your team on the importance of responsible data practices.

Using Market Research Agencies and Ethical Data Collection

By outsourcing market research to a trusted third-party firm, brands can have peace of mind knowing that experts in the field are handling their data collection practices and that appropriate measures are in place to protect consumer privacy. 

However, it is still crucial for brands to thoroughly vet and monitor the practices of their market research partners to ensure they meet their privacy and security standards.

Using a third-party market research firm can provide several benefits for brands regarding data privacy in market research. Some of these benefits include:

  1. Expertise: Market research firms often have specialised knowledge and experience in data privacy and security, which can help ensure that data collection and storage practices comply with applicable laws and regulations.
  2. Resources: Market research firms often have the resources and technology to implement robust security measures and respond to data breaches.
  3. Independence: Using a third-party market research firm can provide a level of independence and objectivity in data collection and analysis, which can help mitigate concerns about bias and privacy violations.
  4. Reputation: Market research firms have a reputation to maintain and are motivated to ensure that data privacy and security practices are of the highest standard.

Summary

The ethics of data collection in market research is an important and complex topic that must be carefully considered. By understanding the importance of ethical data collection, market researchers can ensure that they are protecting consumer data privacy, using collected data in an ethical manner, obtaining informed consent, and implementing appropriate data security measures.

The ethics of data collection is not only a matter of legal compliance but also a matter of maintaining the integrity of market research and respecting the rights of consumers. 

By following best practices for ethical data collection and staying informed about industry regulations and trends, market researchers can ensure that their data collection practices are responsible, honest, and in line with industry standards.

In summary, understanding the ethics of data collection in market research is essential for protecting consumer data privacy, maintaining the integrity of market research, and ensuring responsible data practices. Market researchers must be aware of the importance of ethical data collection and ensure that their data collection practices align with industry standards and best practices.

Ethnographic research is a qualitative research method that systematically studies social and cultural phenomena within their natural contexts. It involves observing and recording human behaviour, practices, and beliefs, often through immersion in the field, participation in activities, and in-depth interviews with participants. Ethnography aims to understand the experiences, perspectives, and culture of the people being studied.

Ethnography has origins in the early 20th century as part of the discipline of anthropology. One of its earliest forms can be traced back to the work of French anthropologist Marcel Mauss, who conducted fieldwork in the French Pacific islands in the early 1900s. However, it is widely considered that the British social anthropologist Bronisław Malinowski, who conducted fieldwork in the Trobriand Islands of Melanesia from 1915 to 1917, is the father of modern ethnography.

Ethnographic research is also known as fieldwork, cultural anthropology, or social anthropology. The method has since been used in a variety of other fields, including sociology, psychology, education, and marketing, to name a few.

Ethnography can provide insights into customers’ motivations, behaviours, attitudes, and beliefs, which can be used to inform the development of new products and services and improve the user experience. Some of the main features of ethnographic research include the following:

Stay ahead

Get regular insights

Keep up to date with the latest insights from our research as well as all our company news in our free monthly newsletter.

  1. Observation: Ethnography typically involves observing participants in their natural settings rather than relying solely on self-reported data.
  2. Interaction: Ethnographic research often involves interacting with participants through structured interviews or informal conversations and observations.
  3. Immersion: Ethnographic researchers often immerse themselves in the culture, community, or market segment they are studying to gain a deeper understanding of the context in which the participants operate.
  4. Long-term commitment: Ethnographic research is often a long-term commitment, as researchers may need to spend several weeks or even months in the field to gain a comprehensive understanding of the culture, community, or market segment they are studying.
  5. Multimodal data collection: Ethnographic research typically involves collecting data from various sources, including observation, interviews, and artifact analysis, to gain a complete picture of the culture, community, or market segment.

How do brands use ethnographic research in their business?

Brands use ethnography to understand their target customers and their behaviour, attitudes, and beliefs. Ethnographic research provides insight into the cultural and social context in which customers live and work, allowing brands to develop products and services that meet their specific needs and preferences.

Some specific ways that brands use ethnographic research include:

  • Product development: Brands can use ethnography to understand how customers use their products in real-life settings, identify pain points and areas for improvement, and develop new products that better meet customers’ needs.
  • Customer segmentation: Ethnographic research can help brands understand their customers deeper, including their values, beliefs, and behaviours. This information can segment customers into groups with similar needs and characteristics, allowing brands to tailor their offerings and marketing efforts accordingly.
  • Brand positioning: Ethnographic research can provide insight into how customers perceive a brand and how it fits into their lives. This information can be used to develop a brand positioning strategy that resonates with customers and sets the brand apart from competitors.
  • Marketing and advertising: Brands can use ethnography to understand how customers respond to different marketing and advertising messages. This allows them to develop campaigns that effectively reach and engage with their target audience.

Ethnography can help brands achieve a range of strategic outcomes, including:

  1. Improved understanding of target audience: Ethnographic research provides a deep and nuanced understanding of the attitudes, behaviours, and experiences of target audiences, which can help brands tailor their products, services, and marketing strategies more effectively to meet the needs and desires of their customers.
  2. Better product design: By observing and understanding how target audiences use and engage with products and services, brands can identify areas for improvement and design products that better meet the needs of their customers.
  3. Enhanced brand awareness and loyalty: By demonstrating a deep understanding of target audiences and a commitment to meeting their needs, brands can build stronger relationships with customers and enhance their brand awareness and loyalty.
  4. Increased market share: By using ethnographic research to understand the needs and desires of target audiences, brands can differentiate themselves from competitors and capture a larger market share.
  5. Improved marketing strategies: By understanding the motivations and attitudes of target audiences, brands can develop more effective marketing strategies that resonate with their customers and drive greater engagement and conversion.
  6. New business opportunities: Ethnographic research can reveal new opportunities for growth and innovation by identifying untapped market segments, new customer needs, or emerging trends in the market.

What are the negatives of ethnography in market research?

While ethnographic research has many benefits, there are also some limitations and potential negatives that should be considered:

  • Time-consuming and resource-intensive: Ethnographic research often requires long periods in the field, conducting observations and interviews, which can be both time-consuming and resource-intensive.
  • Observer bias: Ethnographic researchers may bring their own biases and perspectives to the study, potentially influencing their observations and conclusions.
  • Limited generalisability: Ethnographic research provides a deep understanding of the experiences and perspectives of a particular group or culture, but it may not be possible to generalise these findings to other groups or cultures.
  • Ethical concerns: Ethnographic research often involves collecting sensitive and personal information from participants, which can raise ethical concerns around privacy and informed consent.
  • Difficult to quantify: Ethnographic research often relies on qualitative data, such as observations and interviews, which can be challenging to quantify and compare to other research methods.
  • Potential for researcher bias: The researcher’s personal experiences and preconceptions may affect their interpretation of the data.

What are the steps taken when conducting ethnographic research?

The steps involved in conducting ethnographic research can vary depending on the research question, the setting, and the research methods used, but typically include the following:

Step 1 – Defining the research question: Researchers start by defining the research question or problem they aim to address through ethnographic research.

Step 2 – Selecting the setting and participants: Researchers then select the location or environment where the research will be conducted and the participants who will be studied. This may involve identifying a community, group, or culture relevant to the research question.

Step 3 – Gaining access to the setting and participants: Researchers then need to gain access to the location and participants, which may involve establishing relationships with key individuals or organisations, obtaining permission to conduct research, and negotiating ethical considerations.

Step 4 – Conducting observations: Researchers then spend time in the field observing the activities, behaviours, and interactions of the participants, taking detailed field notes and documenting their observations.

Step 5 – Conducting in-depth interviews: In addition to observations, ethnographic research often involves conducting in-depth interviews with participants to gain a deeper understanding of their experiences and perspectives.

Step 6 – Analyzing the data: Once the data have been collected, market researchers then analyse the data to identify patterns, themes, and relationships. This may involve coding the data, identifying categories and themes, and making connections between the data and the research question.

Step 6 – Reporting the results: Finally, researchers report the results of the ethnographic research, typically in the form of a written report. This may involve presenting the findings, discussing the implications of the results, and making recommendations for future research.

What is a typical timeline for conducting ethnographic research?

The timeline for conducting ethnographic research can vary widely depending on the scope and complexity of the study, as well as the resources and funding available. However, a typical timeline for ethnographic research may look like this:

  • Planning and preparation (1-3 months): Researchers plan and prepare for the ethnographic study, including defining the research question, selecting the setting and participants, and obtaining ethical approval.
  • Data collection (3-12 months): Researchers spend time in the field collecting data through observations and in-depth interviews. This stage can last anywhere from several weeks to several months, depending on the complexity of the study.
  • Data analysis (1-3 months): Researchers analyse the data collected during the data collection stage, identifying patterns, themes, and relationships.
  • Writing and reporting (1-3 months): Researchers write the results of the ethnographic study and prepare a report.
  • Dissemination (ongoing): Researchers may present the results of the ethnographic study at conferences or workshops or share the findings with stakeholders or participants.

Some ethnographic studies may be completed in a few months, while others may take several years. The key is to plan the timeline carefully and to allocate sufficient resources and funding to ensure the study is completed effectively.

How can researchers limit research bias when conducting ethnographic research?

Overall, the goal is to be transparent and explicit about the research process, to be aware of personal biases and preconceptions, and to use multiple data sources and evidence-based methods to analyse the data. By being mindful of these strategies, researchers can increase the validity and reliability of the findings and reduce the potential for research bias in ethnographic research. There are several strategies that researchers can use to limit research bias when conducting ethnographic research, including:

  1. Triangulation: Using multiple data sources, such as observations, interviews, and documentary sources, can help reduce the influence of researcher bias and increase the credibility of the findings.
  2. Reflexivity: Researchers can be mindful of their own experiences, perspectives, and preconceptions and reflect on how these may influence their observations and interpretations. Keeping a reflexive diary or journal can be a helpful tool for this process.
  3. Member checking: Researchers can involve participants in the research process by sharing findings and seeking feedback, which can help validate the findings and reduce the influence of researcher bias.
  4. Peer review: Researchers can share their findings and methods with other experts in the field for review and critique, which can help identify and address any biases or limitations in the research.
  5. Evidence-based analysis: Researchers can use systematic, evidence-based methods to analyse the data, such as coding and categorising the data and using statistical techniques to test hypotheses.
  6. Cultural sensitivity: Researchers should be culturally sensitive when conducting ethnographic research, and be mindful of the potential influence of cultural differences on their observations and interpretations.
  7. Collaboration: Researchers can collaborate with members of the community or culture, increasing the credibility of the findings and reducing the influence of researcher bias.

Can ethnography be conducted across multiple countries, languages, and regions, or is it specific to one culture or region?

Ethnographic research can be conducted across multiple countries, languages, and regions. Many ethnographic studies are designed to be cross-cultural, looking at how different cultures or communities experience and understand similar social, cultural, or economic issues. However, conducting ethnographic research across multiple countries, languages, and regions can be challenging and requires careful planning and preparation.

Some of the main challenges of cross-cultural ethnography include the following:

  • Language barriers: Researchers may need to hire interpreters or be able to speak the language of the participants to conduct effective interviews and observations.
  • Cultural differences: Researchers need to be aware of how they may influence their observations and interpretations.
  • Logistical challenges: Conducting ethnographic research in multiple countries or regions can be logistically challenging, requiring travel, visas, and a flexible research schedule.
  • Sampling and recruitment: Recruiting participants in multiple countries or regions can be difficult and may require using different sampling strategies, such as snowball sampling or purposive sampling.

Despite these challenges, cross-cultural ethnography can be extremely valuable, providing a rich and nuanced understanding of how different cultures and communities experience and understand similar issues. To overcome these challenges, researchers should carefully plan their study, allocate sufficient resources, and be mindful of the cultural and linguistic context in which they work.

How can brands ensure they get a good sampling of respondents in an ethnographic research study?

Obtaining a good sample of participants is an essential aspect of ethnographic research, as it can affect the validity and generalisability of the findings. 

It’s important to note that different sampling methods may be appropriate for different stages of the research, and researchers may use a combination of techniques to obtain a representative sample of participants. The choice of sampling method will depend on the research question, the resources available, and the study’s goals.

Overall, obtaining a good sample of participants is essential for the validity and generalisability of the findings in ethnographic research. Researchers should carefully consider their sampling strategy, allocate sufficient resources for recruiting participants, and be transparent about their methods for recruiting and selecting participants. 

Brands can ensure they get a good sampling of participants by following these strategies:

  1. Purposeful sampling: Researchers can use purposeful sampling to select participants based on specific criteria, such as age, gender, or occupation, to obtain a sample that is representative of the population of interest.
  2. Snowball sampling: Researchers can use snowball sampling, where participants refer others who meet the criteria for participation, to recruit participants who may be difficult to reach through other means.
  3. Maximum variation sampling: Researchers can use maximum variation sampling to select participants who represent a range of perspectives and experiences within the population of interest.
  4. Theoretical sampling: Researchers can use theoretical sampling, where participants are selected based on the theory being tested, to obtain a sample representative of the studied theoretical construct.
  5. Convenience sampling: Researchers can use convenience sampling, where participants are selected because they are easily accessible, to obtain a quick and low-cost sample of participants.

What types of questions are asked during an ethnographic research study?

In ethnographic research, it’s important to observe participants in their natural environment and to use other research methods, such as participant observation and document analysis, in addition to asking questions. This allows researchers to gather a comprehensive understanding of the experiences and perspectives of participants. In an ethnographic research study, researchers typically ask various questions to understand participants’ experiences, perspectives, and behaviours. These questions may include the following:

  1. Open-ended questions: Open-ended questions, such as “What do you think about…?” or “Can you describe a typical day for you?” allow participants to express their thoughts and experiences in their own words and can provide rich and detailed information about the participant’s perspective.
  2. Probing questions: Probing questions, such as “Can you tell me more about that?” or “What makes you say that?” can encourage participants to elaborate on their answers and provide more in-depth information about their experiences.
  3. Contextual questions: Contextual questions, such as “What do you like about your neighbourhood?” or “How does your job affect your daily life?” can provide information about the participant’s context and help researchers understand how their experiences and behaviours are influenced by their environment.
  4. Direct questions: Direct questions, such as “Do you feel that…?” or “Have you experienced…?” can provide more concrete information about participants’ experiences and behaviours.
  5. Follow-up questions: Follow-up questions, such as “Why do you think that is?” or “What makes you feel that way?” can be used to explore participants’ responses further and gain a deeper understanding of their perspectives.

How do market researchers ensure they get good and relevant information from a field study or ethnographic research?

Market researchers should be mindful of the limitations and biases inherent in ethnographic research. They should strive to collect high-quality, relevant information by using a combination of research methods, carefully selecting participants, and using a structured approach to data collection. Ensuring that the information obtained from a field study or ethnographic research is robust and relevant is crucial for the study’s success. Here are some strategies that market researchers can use to achieve this:

  • Clearly define the research objective: A clear understanding of the research objective can help researchers determine the types of information they need to collect and how they can collect it.
  • Use multiple methods: Combining different research methods, such as participant observation, in-depth interviews, and document analysis, can provide a more comprehensive understanding of the phenomenon being studied.
  • Choose the right participants: Selecting participants who are representative of the population of interest and have relevant experiences and perspectives can help ensure that the information collected is relevant and valuable.
  • Develop a rapport with participants: Building a rapport with participants can help them feel more comfortable sharing their experiences and perspectives, leading to more accurate and valuable information being collected.
  • Ask open-ended questions: Asking open-ended questions that encourage participants to share their experiences and perspectives in their own words can provide valuable insights into their behaviour and experiences.
  • Use a structured approach: Using a structured approach to data collection, such as using a standardised questionnaire or following a consistent interview guide, can help ensure that the information collected is consistent and comparable across participants.
  • Consider cultural and linguistic differences: When conducting field studies or ethnographic research in multiple countries, regions, or with participants from different cultures, it’s important to be aware of cultural and linguistic differences and to adapt the research methods accordingly.
  • Triangulate data: Triangulating data, or using multiple sources of information to validate findings, can help ensure that the information collected is accurate and reliable.

How do you calculate a statistically viable sample in an ethnographic research project?

Calculating a statistically viable sample in an ethnographic research project can be challenging. The sample size required may vary depending on the research design, the population of interest, and the detail required in the analysis. 

It’s recommended that the sample size in ethnographic research projects be larger than in other types of research, as ethnographic research is often more qualitative and may not rely on statistical analysis. The sample size should also be large enough to ensure that the study results are meaningful and can be generalised to the population of interest.

In general, a statistically viable sample size in ethnographic research is typically determined based on the following factors:

  1. Representativeness: The sample size should be large enough to ensure that the participants represent the population of interest. For example, if the population of interest is a specific demographic group, the sample size should be large enough to ensure that participants from that group are adequately represented.
  2. Statistical power: The sample size should be large enough to ensure that the study results have sufficient statistical power. This means that the study has a high probability of detecting a meaningful difference between the groups being compared if one exists.
  3. Precision of estimates: The sample size should be large enough to ensure that the estimates generated from the study are precise. This means that the estimates are accurate and have a low level of variability.
  4. Type of analysis: The sample size will also depend on the type of analysis being performed. For example, suppose the study uses regression analysis to examine the relationship between two variables. In that case, a larger sample size may be required compared to a study that simply describes the distribution of a single variable.

It’s also important to note that sample size is just one aspect of determining the statistical viability of a study. Other factors, such as the quality of the data, the validity of the measurement instruments, and the rigour of the research design, also play a role in ensuring that the results of an ethnographic research study are statistically viable.

How is the information recorded in an ethnographic research project? How are respondents or participants typically remunerated?

In ethnographic research projects, the information is typically recorded in various ways, depending on the research design and the study’s goals. Here are some common methods of recording information in ethnographic research:

  • Field notes: Field notes are a written record of observations, thoughts, and insights collected during the study. They may include descriptions of the physical environment, interactions between participants, and observations about the behaviour and attitudes of participants.
  • Audio or video recordings: Audio or video recordings can provide a rich data source for ethnographic research, as they capture the nuances of participant interactions and behaviours that may be missed in written field notes.
  • Photographic records: Photographic records, such as photographs or videos, can provide a visual representation of the study environment and the behaviours and attitudes of participants.
  • Interview transcripts: Interview transcripts are a written record of the questions and answers from in-depth interviews with participants. They can provide valuable insights into participant attitudes and behaviours.

The method of remuneration used will depend on the study’s goals, the population of interest, and the resources available for the study. It’s essential for the researcher to consider the ethical implications of the chosen method of remuneration and to ensure that participants are informed of the terms of their participation before the study begins.

The way that respondents or participants are typically remunerated include the following: 

  • Cash incentives: Participants may be offered a cash incentive for participating in the study, such as a payment for their time or a gift card.
  • Non-monetary incentives: Non-monetary incentives, such as a free product or service, may be offered to participants in exchange for their participation in the study.
  • No remuneration: In some cases, participants may be willing to participate in the study without compensation.

Is ethnographic research always conducted in the field, or can it be conducted online via a conference call?

Ethnographic research can be conducted in a variety of settings, including both in the field and online. While traditional ethnographic research typically involves spending time observing and interacting with participants in the study environment, online ethnographic research is becoming increasingly popular as technology has made it easier to connect virtually with participants.

While online ethnographic research has the advantage of being able to reach a broader and more diverse range of participants, it also has some limitations compared to traditional in-person ethnographic research. For example, online ethnographic research may not capture the richness and complexity of in-person interactions and may be subject to biases and limitations of online platforms and technologies.

Online ethnographic research methods can include:

  1. Virtual observation: Researchers can observe participants in their natural online environment, such as social media platforms or online forums.
  2. Video conferencing: Researchers can conduct in-depth interviews or focus groups with participants via video conferencing platforms.
  3. Online surveys: Researchers can collect participants’ data via surveys or questionnaires.
  4. Remote observation: Researchers can use remote monitoring technologies, such as wearable devices, to collect data from participants.

In general, researchers should consider the best methods for conducting ethnographic research based on the study’s goals, the population of interest, and the resources available for the study. They may use a combination of online and in-person methods to maximise the strengths and minimise the limitations of each approach.

Once data is collected from several audiences or markets during ethnographic research, what examples of comparisons or analysis should a researcher consider?

By comparing and analyzing data from multiple audiences or markets, researchers can gain a deeper and more nuanced understanding of the market or product in question. They can make more informed decisions about product development, marketing, and sales strategies.

Once data is collected from several audiences or markets during an ethnographic research project, the researcher has a wealth of information to analyse and compare. Here are some examples of comparisons and analyses that a researcher might consider:

  • Demographic comparisons: Researchers can compare data across different demographic groups, such as age, gender, income, and education, to understand how different population segments experience the market or product in question.
  • Cultural comparisons: Researchers can compare data across different cultural groups to understand how cultural values and beliefs influence how participants experience the market or product.
  • Behavioural comparisons: Researchers can compare behaviours, such as purchasing patterns or usage habits, to understand how different groups of participants use and engage with the market or product.
  • Attitudinal comparisons: Researchers can compare attitudes, such as perceptions, beliefs, and preferences, to understand how different groups of participants feel about the market or product.
  • Geographic comparisons: Researchers can compare data across different geographic locations to understand how regional factors, such as climate, urbanisation, and access to resources, influence how participants experience the market or product.
  • Trend analysis: Researchers can analyse trends over time to understand how attitudes, behaviours, and experiences change and evolve.
  • Thematic analysis: Researchers can identify and analyse recurring themes in the data to gain a deeper understanding of participants’ underlying motivations, attitudes, and experiences.

What are the benefits of hiring a market research agency to conduct an ethnographic study?

The pros of hiring a market research agency to conduct an ethnographic research study include the following:

  1. Expertise and experience: Market research agencies have specialised expertise and experience in conducting ethnographic research, which can help ensure that the study is conducted effectively and efficiently.
  2. Objectivity: Market research agencies are independent of the brand and can provide an objective perspective on the research findings, which can be valuable for brands looking to make informed decisions about their products and services.
  3. Access to resources: Market research agencies have access to a range of resources, including research software, data analysis tools, and a large pool of participants, which can help to improve the quality and accuracy of the research findings.
  4. Cost-effectiveness: Appointing a market research agency can be more cost-effective than conducting the research in-house, as the agency can leverage its existing resources and expertise to complete the research more quickly and efficiently.
  5. Independence: By hiring a market research agency, brands can ensure that the research findings are independent and unbiased, increasing the credibility of the research results and helping build trust with stakeholders.

Conjoint analysis is a quantitative research method used to understand how people evaluate and prioritise product or service features. Participants review sets of product profiles with different combinations of features and are asked to choose or rate their preferences. These choices reveal the relative importance of each feature and how people make trade-offs—insight that guides product development, pricing, and go-to-market decisions.

How Conjoint Analysis Works (with Example)

Conjoint analysis helps brands understand the trade-offs people make when choosing between products. Instead of asking standalone questions, it simulates real-world decision-making by presenting realistic combinations of features.

For example, a smartphone test might compare different combinations of price, storage, screen type, and camera resolution. Participants might be shown:

Option A: £350, 128GB, HD screen, 12MP camera
Option B: £500, 256GB, OLED screen, 24MP camera

By analysing thousands of choices, researchers can quantify the value placed on each feature and forecast which combinations are most likely to succeed—even if they weren’t shown in the test.

This approach uncovers how people weigh function against price in realistic buying scenarios—vital insight for product design, pricing, and marketing strategy.

Understanding the Terminology and Origins of Conjoint Analysis

What Is Conjoint Analysis Also Known As?

Conjoint analysis is sometimes referred to as trade-off analysis. Both terms describe the same technique, though “conjoint analysis” is more widely used in commercial settings. You may also come across the following variants:

  • Conjoint Study
  • Conjoint Measurement
  • Multi-Attribute Trade-Off Study
  • Conjoint Analysis Method / Technique
  • Conjoint Methodology
  • Conjoint Analysis Experiment

All these terms describe the same underlying method: a data-driven way to understand how people make trade-offs between features.

The History of Conjoint Analysis in Market Research

Conjoint analysis emerged from mathematical psychology in the 1960s. It entered commercial market research in the 1970s, led by Dr Fred McCollum, founder of Sawtooth Software, who helped apply it to consumer preference studies.

SSince its early adoption, conjoint analysis has evolved alongside advances in computing and analytics. It is now one of the most trusted methods for guiding product design, pricing strategy, and market positioning across industries.

A Quantitative, Statistical Approach

Conjoint analysis is a quantitative method that translates consumer preferences into numerical data for statistical analysis. Common techniques include:

  • Part-worth utilities – The core output of most conjoint studies, showing how much value consumers assign to each feature level.
  • Regression analysis – Identifies the relationship between product features and consumer preferences.
  • MANOVA (Multivariate Analysis of Variance) – Used to explore how preferences vary across segments or demographic groups.
  • Logit regression – Commonly used in choice-based conjoint to model binary decisions.
  • Conjoint simulation – Forecasts how people might respond to different product combinations, enabling scenario testing and market prediction.

Types of Conjoint Analysis

Different types of conjoint analysis serve different objectives, depending on the complexity of the product and the kind of decisions you’re trying to model. Each format offers unique strengths—and limitations. The three most widely used approaches are:

Ratings-Based Conjoint Analysis
Participants are shown individual product profiles and asked to rate each one using a numerical scale. While this method is straightforward to implement, it’s vulnerable to scale bias—participants may interpret rating scales inconsistently, making it harder to compare responses reliably across individuals.

Ranking-Based Conjoint Analysis
Respondents are asked to rank a series of product profiles in order of preference. This approach delivers a clear hierarchy of choices but offers limited insight into the degree of difference between them. It shows which options are preferred, but not by how much.

Choice-Based Conjoint Analysis (CBC)
The most widely used method today, CBC presents participants with sets of product profiles and asks them to choose the one they’re most likely to buy. It mirrors real-world decision-making more closely than ratings or rankings, capturing the trade-offs consumers actually make. Even product combinations not shown in the survey can be modelled using the resulting data.

Choice-Based Conjoint is particularly valuable because it supports predictive modelling. When set up correctly, it can simulate how consumers would react to new product configurations, helping brands make data-backed decisions about future offerings.

Choosing the Right Attributes and Levels

The strength of a conjoint analysis lies in the attributes you choose to test—those product or service features that truly influence customer decisions. Attributes might include price, performance, screen size, brand, or packaging, depending on your category.

To maintain clarity and statistical reliability, most studies focus on five or six high-impact attributes. Including too many can overwhelm respondents and muddy the data, limiting the usefulness of the results.

Each attribute must be broken down into levels—distinct and realistic variations that reflect the actual choices consumers face. For example:

  • Attribute: Price
    Levels: £200, £350, £500
  • Attribute: Storage Capacity
    Levels: 64GB, 128GB, 256GB

These levels should be spaced far enough apart to reveal meaningful trade-offs. Too-similar options reduce the ability to detect preference shifts.

When defining attributes and levels, consider the following:

  • Relevance to Business Decisions: Focus on the features you’re actively evaluating or could realistically change.
  • Avoiding Bias: Ensure the levels are plausible and balanced to prevent nudging responses in one direction.
  • Market Realism: Keep combinations grounded in what your audience might genuinely encounter.

A well-crafted attribute set creates the foundation for reliable modelling and insight. It enables researchers to simulate buying behaviour, assess product-market fit, and predict how consumers might respond to future offerings.

Stay ahead

Get regular insights

Keep up to date with the latest insights from our research as well as all our company news in our free monthly newsletter.

Designing an Effective Conjoint Survey

Choosing the right attributes is only half the equation. To unlock the full value of conjoint analysis, the survey itself must be meticulously constructed—clear in purpose, intuitive to navigate, and capable of capturing meaningful data. Good design doesn’t just improve response rates; it enhances the depth and reliability of the insights you generate.

Start with the right respondents
A successful conjoint study begins with the right audience. Use screener questions to filter participants who reflect your target market—whether by age, location, income, purchase behaviour, or decision-making role. Including the wrong respondents risks distorting the data and undermining the study’s purpose.

Explain the task clearly
Conjoint surveys require mental effort. A concise, well-worded introduction sets expectations and improves respondent engagement. Participants should understand what they’ll be asked to do, how the choices work, and why their input matters. Clear instructions reduce abandonment rates and yield more thoughtful responses.

Keep the flow logical
Survey flow influences focus. Group related questions together, use consistent formatting, and avoid abrupt changes in layout or tone. A coherent structure helps respondents remain engaged, especially in longer studies that involve repeated comparison tasks.

Use realistic scenarios
Context improves response quality. Rather than abstract prompts like “Which would you choose?”, frame questions in practical, familiar settings. For example:

“You’re looking to upgrade your current phone. If these were your only options, which would you choose?”

Contextual framing mirrors real decision-making and yields more accurate reflections of consumer preference.

End with demographics
Leave demographic and profiling questions until the end. This keeps the main trade-off tasks uninterrupted, ensuring respondents focus fully on the core activity. Demographic data can then be used to segment findings, revealing preference differences across audience types and improving the study’s strategic impact.

Analysing Results and Turning Insight into Action

Once responses are collected, the real value of conjoint analysis comes into focus. This stage is where strategic insight is extracted from what appears to be simple choice data.

By applying statistical techniques, researchers calculate part-worth utilities—numerical values that quantify how much weight consumers place on each product feature or level. These scores uncover which features drive decision-making, and what trade-offs people are genuinely willing to make.

From this, brands can understand:

  • Which attributes have the greatest impact on consumer choice
  • What customers are willing to give up to gain a preferred feature
  • How preferences vary across different demographic or behavioural groups
  • Which product or service combinations are most likely to succeed commercially

Advanced methodologies also enable conjoint simulation, allowing brands to test product configurations that weren’t shown in the original survey. For example, if you’re developing a premium product with features still in concept phase, you can model its likely reception before it hits the market.

These insights directly shape:

  • Product development roadmaps, by highlighting the features that matter most
  • Pricing strategy, based on willingness to pay across segments
  • Marketing messaging, tailored to emphasise high-utility features
  • Investment decisions, supported by robust, data-backed projections

Where traditional research often reveals what people say, conjoint analysis gets closer to what they actually choose—especially when faced with real-world constraints. That distinction is what makes it a powerful tool for brands looking to build, refine, or reposition products with confidence.

Weighing the Pros and Cons of Conjoint Analysis

The true power of conjoint analysis lies in its ability to reveal not just what customers say they want, but how they make decisions when real trade-offs are involved. But like any research method, it comes with strengths and limitations.

ProsCons
Insights into consumer preferences – Helps identify what features customers value most and how they make trade-offs.Limited feature sets – Only a small number of attributes can be tested at once, which may exclude niche or emerging features.
Realistic purchase scenarios – Mirrors real-world decision-making better than traditional surveys.Response bias – Participants may still rely on brand familiarity or assumptions not presented in the test.
Scalable for large samples – Works well with large respondent groups and supports segmentation.Complex analysis – Requires specialised statistical tools and expertise to interpret results effectively.
Cost-effective – Often cheaper than qualitative methods for testing feature combinations.Limited real-world context – Does not fully replicate in-store, online, or social influences on behavior.

How to Run a Conjoint Study: Step-by-Step Workflow

Running a successful conjoint study requires careful planning and execution. From defining objectives to translating results into action, each step builds on the last. Here’s how the process typically unfolds:

Step 1 – Design and Development
Start by clarifying the business question. Then select a manageable set of attributes and levels that reflect real purchase decisions. Write clear survey instructions and program realistic product combinations that participants can evaluate.

Step 2 – Recruitment
Find participants who represent your target audience. Depending on your market, this might involve tapping into online panels, databases, or in-person intercepts.

Step 3 – Data Collection
Launch the survey and monitor progress to ensure high-quality responses. Timelines vary but typically range from a few days to several weeks.

Step 4 – Data Analysis
Apply statistical models to quantify how participants value each feature. This step produces part-worth utilities, identifies feature importance, and enables scenario testing for new product configurations.

Step 5 – Reporting and Action
Translate the data into commercial outcomes: pricing strategies, product bundles, go-to-market plans, and segmentation insights that support more confident decision-making.

Partnering with experts at this stage ensures the outputs are not only statistically sound but also strategically relevant.

Minimizing Bias in Conjoint Analysis

Even the best-designed conjoint study can be undermined by bias if not managed carefully. These steps help protect data integrity:

  • Use a representative sample to reflect your target population.
  • Randomize product profiles and feature order to avoid position effects.
  • Avoid leading or suggestive language that might skew choices.
  • Provide clear instructions so respondents fully understand the task.
  • Offer incentives to increase response rates and attention levels.
  • Conduct a pre-test to catch any confusing wording or design flaws.
  • Triangulate results with qualitative methods like interviews to validate findings.

Attention to these details ensures your conjoint results are a true reflection of customer preferences—not artifacts of survey design.

Industries That Commonly Use Conjoint Analysis

Conjoint analysis is especially valuable in markets where customers must weigh multiple competing features. Common use cases include:

  • Consumer Goods – To optimise packaging, product features, or flavour options.
  • Healthcare – To understand patient or provider preferences for treatment alternatives.
  • Financial Services – To test appetite for bundled products like credit cards or insurance plans.
  • Automotive – To prioritise features such as safety, performance, or technology.
  • Telecommunications – To design plan tiers, hardware options, and value-added services.

These sectors rely on conjoint to navigate complexity and make informed trade-offs in product development.

What Can Conjoint Analysis Help You Achieve?

Used correctly, conjoint analysis becomes a strategic asset. It provides insight that can drive decisions across your organisation:

  • Better Product Design – Identify which features matter most to your audience and build around them.
  • Stronger Pricing Strategy – Understand willingness to pay and adjust pricing to capture more value.
  • Deeper Customer Insight – Reveal how people really make decisions—not just what they claim to prefer.
  • Effective Segmentation – Uncover distinct groups with different trade-offs and tailor your strategy accordingly.
  • Higher Launch Success – Test concepts before they hit the market and prioritise those with the strongest appeal.
  • Confident Decision-Making – Replace guesswork with statistically grounded evidence.

How to Prioritise Product Attributes in Conjoint Studies

Deciding which features to include in a conjoint study is one of the most critical parts of the process. Overloading the survey with too many variables makes results less reliable—and the experience more fatiguing for respondents.

Start with Qualitative Discovery
Use internal workshops, focus groups, or early-stage interviews to identify the features that matter most. Align the findings with your business goals.

Keep It Manageable: 4 to 10 Attributes
The sweet spot for most studies is four to ten attributes. Fewer might miss key trade-offs; more can lead to poor data quality. For example:

  • A smartphone study may test six attributes like battery life, screen size, camera quality, brand, and price.
  • An automotive study might include ten features, such as safety systems, fuel efficiency, and design.

Evaluate Each Attribute Carefully
Only include features that:

  • Show clear variability across levels
  • Can be implemented or changed in your product roadmap
  • Are understood by your audience without ambiguity
  • Have real influence on decision-making

Pilot the Study First
Run a small-scale version to refine language, survey length, and level combinations. This ensures everything is clear before full launch.

Why Fewer Features Yield Better Trade-Off Data

At its core, conjoint analysis is a test of choices. The more attributes you include, the harder it becomes for participants to make realistic trade-offs. This complexity increases survey fatigue and can compromise the quality of your data.

For each chosen attribute, define clear levels that reflect real-world options. For instance:

  • Storage: 64GB, 128GB, 256GB
  • Price: $200, $350, $500

By simplifying the decision set, you force respondents to reveal what matters most. This leads to cleaner statistical models and more reliable insights.

The Conjoint Research Process: From Setup to Insight

Once the attributes and levels are defined, the study moves through a structured research pipeline. While timelines vary, the process typically follows this structure:

Step 1 – Study Design
Clarify the research question, select attributes, draft the survey script, and program the conjoint experiment.

Step 2 – Recruitment
Secure a sample that matches your customer base. Depending on geography and sample size, this may take several days or weeks.

Step 3 – Data Collection
Field the survey and monitor responses in real time to ensure quality and completeness.

Step 4 – Data Analysis
Use models such as part-worth utilities and segmentation to quantify trade-offs and predict market outcomes.

Step 5 – Reporting
Translate the findings into feature priorities, pricing strategies, product bundles, and strategic recommendations.

A rigorous process doesn’t just ensure statistical precision—it helps brands act confidently on the insights uncovered.

Why Work With a Market Research Agency?

While some brands run conjoint studies in-house, working with an experienced research partner like Kadence International brings distinct advantages:

  • Expert Design: We know how to craft meaningful trade-offs and avoid survey fatigue.
  • Advanced Modeling: From segmentation to simulations, we apply advanced techniques to extract deeper insights.
  • Objective Perspective: An external partner brings neutral interpretation—free from internal pressures or bias.
  • Resource Efficiency: We manage recruitment, fieldwork, and analysis so your team can stay focused on strategy.
  • Credibility and Quality: A third-party study often carries more weight with internal and external stakeholders.

Explore our conjoint analysis services or speak with us about tailoring a study for your product or market challenge.

Work with Experts to Maximise Your Impact

Conjoint analysis can unlock the features, pricing, and combinations that truly influence customer decisions—but only when executed with precision. From defining meaningful attributes to designing the right survey and applying advanced analytics, every step requires expertise.

At Kadence International, we’ve conducted conjoint studies across sectors including consumer goods, telecoms, healthcare, and financial services. Our team ensures your study is grounded in sound methodology, free from bias, and focused on outcomes that inform real-world decisions.

Whether you’re testing new product concepts, evaluating pricing strategies, or preparing for market expansion, we help you generate insights that lead to growth.

Explore our conjoint analysis services or get in touch to discuss your next project.

Focus groups are a qualitative market research method involving a small, diverse group of participants brought together to discuss a particular topic, product, or service. Through facilitated discussion, they uncover deeper insights into consumer attitudes, opinions, behaviours, and emotional drivers—insights that are often missed in quantitative research.

Also referred to as ‘group interviews’ or ‘group discussions,’ focus groups are employed across industries—from market research and psychology to sociology and policy analysis. They help organisations understand how people think, feel, and make decisions in a social setting.

Brands use focus groups to better understand their target audiences—exploring consumer language, reactions, unmet needs, and how people respond to product positioning or messaging. The qualitative nature of focus groups allows for nuance that standardised surveys cannot capture.

Focus groups offer several key advantages. They enable researchers to explore not just what people say, but how they say it—capturing nonverbal cues, tone, and the dynamics between participants. When the research goal is exploratory or emotive, focus groups often yield richer insight than structured surveys or polls.

While focus groups are powerful tools, they’re not without limitations. Discussions can be influenced by dominant voices, moderator bias, or social desirability effects. And because the sample size is small, results are directional—not statistically representative.

The Origins of Focus Groups

First developed in the 1940s, focus groups were initially used to gauge public reactions to wartime messaging and consumer products. Since then, they’ve evolved into a staple of modern research, spanning industries from advertising and media to healthcare and policy.

TThe conceptual foundation of focus groups was laid by Paul Lazarsfeld and sociologist Robert K. Merton at the Bureau of Applied Social Research. Merton, often called the “father of focus groups,” coined the term to highlight both the collective nature of the session and the central focus of discussion.

One of the earliest documented focus groups was conducted during World War II to assess reactions to anti-Nazi radio broadcasts. As public sentiment was hesitant about entering the war, researchers invited participants to listen to recordings and register their reactions in real time—pressing buttons to indicate approval or disapproval.

The Mechanics of Running Focus Groups

Selecting focus groups as a research method requires a thoughtful approach—starting with a clear understanding of the target audience, the specific research objectives, and the available resources. These foundational decisions shape everything from recruitment criteria to how insights will be applied. 

A well-crafted discussion guide is vital to making a focus group productive. It helps the moderator maintain structure while allowing the conversation to flow naturally. A skilled moderator will balance guidance with openness—ensuring rich discussion without leading participants.

A discussion guide is a structured outline of questions and prompts used by the moderator to steer the session while keeping it open and exploratory. It ensures key topics are addressed without turning the conversation into a rigid interview. Think of it as a flexible roadmap—designed to keep the discussion on course without stifling spontaneity.

Also, read “The importance and types of Research Design” here.

A typical discussion guide includes the following components:

  • Introduction – Briefs participants on the session’s purpose and sets expectations.
  • Objectives – Clarifies the key goals that the discussion should uncover.
  • Open-ended Questions – Encourages free-form responses and deeper insights, forming the core of the discussion.
  • Probes – Follow-ups or clarifiers used to dig deeper into specific statements or ideas.
  • Group Activities – Exercises that spark creativity, collaboration, or prioritisation.
  • Closing Discussion – Summarises key points and invites final reflections or overlooked insights.

Most focus groups involve 6 to 10 participants in a guided discussion led by a trained moderator. Participants are selected to reflect the target audience for a specific product, service, or concept. Sessions typically last between 60 and 120 minutes, with participants compensated—often with cash or a gift voucher—for their time and contributions.

Confidentiality is a cornerstone of focus group research. Brands typically ask participants to sign non-disclosure agreements (NDAs) and ensure discussions are held in private, secure environments. This builds trust and encourages more open, candid feedback.

Grouping participants by key demographics—such as age, income, education, or gender—is common practice in focus group research. These categories often shape how people interpret products, services, or messages. Segmenting by demographics allows researchers to draw clearer insights into how different groups think, feel, and behave.

In some cases, grouping by usage behaviour or product experience may be more relevant than demographics. For example, segmenting by first-time users versus regular users can reveal different attitudes. If the study already targets a specific demographic, further segmentation may not be necessary.

Ultimately, participant grouping should align with the research question and study objectives. Researchers must determine which variables—be it demographics, usage, or attitudes—will generate the most actionable insights.

Focus groups are often held in dedicated research facilities or rented venues tailored for qualitative sessions. These spaces are designed to offer a professional yet comfortable environment, equipped with everything needed to ensure the session runs smoothly—from recording technology to observation rooms.

Characteristics of a professional focus group facility often include:

  • Privacy – Soundproofing and restricted access to ensure confidential discussion.
  • Comfort – Ergonomic seating and ambient lighting to help participants feel at ease.
  • Technology – Tools for audio/video recording, live streaming, and presentations.
  • Observation Room – One-way mirrors or video feeds for unobtrusive client and researcher viewing.
  • Breakout Rooms – Spaces for smaller group sessions or follow-up interviews.
  • Control Room – A hub for managing recordings and technical aspects.
  • Reception Area – Where participants are welcomed, briefed, and prepared.
  • Catering – Light refreshments to maintain energy and foster a relaxed setting.

A standard focus group agenda might include:

  • Introduction – Moderator welcomes participants and outlines the purpose of the session.
  • Icebreaker – A light activity to build rapport and reduce social tension.
  • Participant Background – Gathering demographic or contextual details to support segmentation.
  • Core Discussion Topics – Open-ended questions aligned with research goals.
  • Group Activities – Brainstorming, ranking exercises, or concept testing.
  • Break – A short intermission, especially for sessions longer than 90 minutes.
  • Closing Discussion – Recap of key points and space for final reflections.
  • Wrap-Up – Moderator thanks participants, explains next steps, and discusses compensation.

Every agenda should be tailored to the session’s objectives, research questions, and timing. Depending on the brief, it may also include product testing, creative mock-ups, or ad concept reviews to prompt participant reactions.

Sample questions used in focus groups might include:

“What are your first impressions of this product or service?”

“What would motivate or prevent you from choosing it?”

“How does this compare to other options you’ve used or seen?”

These open-ended prompts are designed to surface honest opinions, reveal trade-offs, and expose emotional responses—insight that can guide messaging, design, and strategy.

The Role of a Focus Group Moderator

A skilled moderator is critical to the success of a focus group. Their role is to create an open, focused environment that encourages diverse perspectives. Key responsibilities include:

  • Keeping the conversation aligned with research objectives
  • Ensuring all participants have the opportunity to speak
  • Maintaining a respectful and balanced dynamic within the group

Moderators often come from backgrounds in marketing, sociology, psychology, or behavioural sciences. While educational requirements vary by industry, a bachelor’s degree in a related field is typically preferred—along with hands-on experience in research. A strong foundation in qualitative methods and data analysis is essential, especially when the moderator is involved in reporting or synthesis.

Beyond qualifications, the most effective moderators possess strong communication skills, empathy, and the ability to read group dynamics in real time. They must lead discussions with confidence—guiding without influencing—and adapt when conversations veer off track or become dominated by one voice.

Working with an experienced moderator is strongly recommended. Brands can engage focus group specialists through research consultancies like Kadence International, which offer both moderation and end-to-end project delivery. Alternatively, independent moderators can be sourced via professional networks, provided their expertise aligns with the research brief.

What are the Benefits of Focus Group Research?

Focus groups offer several compelling advantages for brands and researchers alike:

  • Rich insights – Participants share detailed views, stories, and emotional responses that quantitative surveys may miss.
  • Dynamic interaction – The group setting enables participants to challenge, build upon, or clarify one another’s thoughts, often leading to unexpected insights.
  • Adaptability – Focus groups can be tailored to explore a broad range of topics—from brand perception and packaging to service experience and ad concepts.
  • Cost-effectiveness (relatively) – While more expensive than surveys, they often cost less than conducting multiple in-depth interviews for similar depth.
  • Observational value – Researchers can interpret tone, body language, and group dynamics, adding context to participant responses.
  • Real-world simulation – Sessions can be designed to mimic consumer environments, offering clues about how a product or service will be experienced in the real world.

What are the Drawbacks of Focus Groups?

Focus groups aren’t without limitations. Key drawbacks to consider include:

  • Group bias – Social pressure or dominant voices may influence participant responses, reducing authenticity.
  • Recruitment bias – Participants may not fully reflect the target population, especially if incentives attract a narrow type of respondent.
  • Cost and logistics – Compared to surveys, focus groups involve more planning, coordination, and expense.
  • Time intensity – To gain meaningful insights, multiple sessions may be required—each involving setup, moderation, and analysis.
  • Moderator influence – The tone and behaviour of the moderator can unintentionally steer the conversation, impacting the neutrality of the results.

To mitigate these potential negatives, it’s crucial to conduct focus groups as part of a more extensive research study and to carefully consider the recruitment, moderation, and data analysis methods to ensure the results are reliable and valid.

What Can Go Wrong in a Focus Group?

Even well-designed sessions can face challenges. Issues that may arise include:

  • Uneven participation – Some attendees may stay quiet or disengaged, reducing the diversity of input.
  • Dominant voices – A vocal participant might steer the conversation or suppress dissenting views.
  • Technical problems – Equipment failures or poor audio quality can compromise recording and analysis.
  • Groupthink – Participants may echo the majority opinion rather than sharing their own views.
  • Ethical oversights – Without proper consent and briefing, participants may feel exposed or misled.

Skilled moderation and robust planning help minimise these risks—ensuring the insights collected are both rich and reliable.

“Groupthink” occurs when participants align with dominant opinions rather than expressing their true thoughts. To reduce its impact:

  • Encourage diverse viewpoints early in the session.
  • Ask participants to write down initial thoughts before sharing aloud.
  • Use open-ended and probing questions.
  • Consider smaller breakout groups to foster independent thinking.
  • Keep the moderator neutral in tone and body language.

The goal isn’t to eliminate group dynamics but to create conditions that support independent and authentic contributions.

Comparison of Focus Groups vs. Other Research Methods

Research MethodKey CharacteristicsBest Used ForProsCons
Focus GroupsSmall group of participants discussing a topic in a moderated setting.Gaining in-depth qualitative insights, exploring new concepts, understanding consumer behaviors and attitudes.Rich qualitative data, non-verbal communication insights, group dynamics, real-time discussion.Potential for groupthink, smaller sample size, more expensive than surveys.
SurveysStructured questionnaires filled out by individual participants.Collecting quantitative data from a larger sample size.Cost-effective, large sample size, quick data collection.Lack of in-depth insights, no group dynamics, limited ability to explore complex topics.
In-depth InterviewsOne-on-one conversations with participants to gather detailed qualitative insights.Exploring individual behaviors, motivations, and attitudes deeply.Detailed, rich data, no influence from group dynamics.Time-consuming, more expensive, limited to individual perspectives.
Ethnographic ResearchObserving participants in their natural environment to understand behaviors and interactions in real-world contexts.Understanding behaviors in natural settings, product usability, consumer habits.Authentic insights, understanding real-world usage.Time-consuming, requires high investment, difficult to scale.
Online CommunitiesA virtual group of participants who engage in discussions over time, usually in an online forum or community setting.Building deeper engagement with a community over time, exploring evolving consumer attitudes and behaviors.Flexible, participants can engage over time, good for long-term studies.Participants may drop off, online setting limits non-verbal cues and immediate feedback.

Which is Better – Focus Groups or Surveys?

Focus groups and surveys serve different—but often complementary—purposes. Focus groups are ideal for exploring emotional reactions, uncovering motivations, and observing group dynamics and nonverbal cues. They are especially useful in early-stage concept testing or when the objective is to understand why people think or behave a certain way.

Qualitative surveys, by contrast, allow for broader reach. They’re faster to deploy, less costly, and better suited to gathering directional input from a more diverse or geographically dispersed audience.

Neither method is “better”—it depends on your goals. Many successful research programmes integrate both approaches, using surveys for breadth and focus groups for depth.

When Are Focus Groups the Right Choice?

Focus groups are ideal when your goal is to explore attitudes, emotions, and reactions in a social context. They shine in early-stage research—when you’re testing concepts, messaging, or creative stimuli—and you want to understand why people think and feel the way they do. The group format allows for layered insights that emerge through discussion, disagreement, and shared storytelling.

But they’re not always the right tool. In-depth interviews are better for sensitive topics or when individual experience matters more than group interaction. For longitudinal insight or real-time collaboration, online communities or mobile diaries might be more effective.

The best research designs don’t ask which method is best—they ask which combination provides the fullest picture.

How to Get the Most from Your Next Focus Group

Getting powerful insights from a focus group isn’t just about asking good questions—it’s about how the session is designed, moderated, and analysed. Here are five ways to increase the impact of your next group:

  • Be laser-focused on your objective. Every element—from the screener to the guide—should align with what you need to learn.
  • Recruit for attitudes, not just demographics. Surface-level segmentation won’t reveal much if participants don’t care about the topic.
  • Pilot your guide. Even five minutes of rehearsal can catch confusing phrasing or structural issues.
  • Watch the energy in the room. Great moderators know when to dig, when to pivot, and when to let silence do the work.
  • Debrief while it’s fresh. Insight fades quickly if observations and hunches aren’t captured immediately after the session.

A well-run focus group doesn’t just capture opinion—it surfaces unmet needs, emotional triggers, and the language consumers use to describe their world.

Market research consultancies like Kadence International support brands throughout the entire focus group process, from recruitment and moderation to analysis and strategic application of insights.

If you’re exploring whether focus groups are the right fit for your research goals, submit a brief and one of our team members will get in touch to advise on next steps.

Stay ahead

Get regular insights

Keep up to date with the latest insights from our research as well as all our company news in our free monthly newsletter.