Understanding how to calculate market size is a critical step in evaluating whether your product can succeed or whether you’re investing in an untested and potentially unprofitable niche. 

Accurate market size calculation is crucial to business success. This foundational element of market size analysis enables senior leaders to navigate complex market conditions and make informed strategic decisions. Understanding how to calculate potential market size is especially important when entering a new market or launching a product. Without solid data, companies may misallocate resources and overestimate demand.

Robust market size analysis, grounded in data, offers brands a strategic edge. By studying consumer demand, market trends, and competitor positioning, companies can identify market gaps and avoid strategic missteps. This is particularly important in global market sizing, where economic factors and purchasing behaviors vary regionally.

To stay competitive, brands must move beyond static estimates. Using AI-driven predictive models and real-time data tools transforms traditional market size calculation into a dynamic, responsive strategy. These tools help adapt to changing consumer behavior and regional conditions.

What is Market Size?

Market-sizing

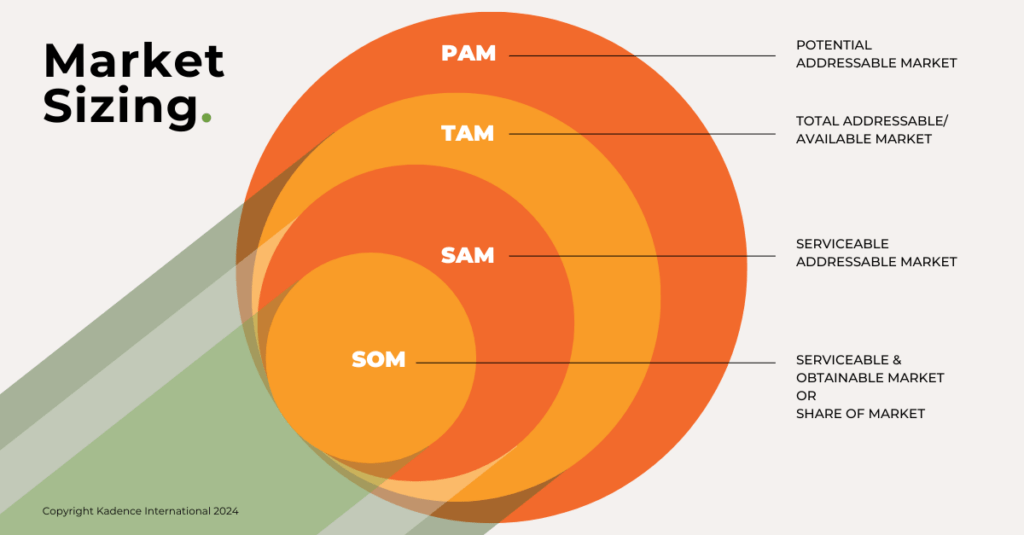
Market size refers to the total potential revenue or sales volume a business can achieve within a specific market. Understanding market size calculation involves breaking it down into two key components:


Total Addressable Market (TAM): The overall demand for your product or service across all potential customers.

Serviceable Available Market (SAM): The share of the TAM that your business can realistically serve based on your capabilities, competitors, and market access.

While TAM gives a high-level view, SAM provides a practical foundation for more targeted market size analysis.

Why Market Size Matters for Businesses

Understanding market size is essential for companies because it underpins goal setting, strategic planning, and risk assessment. Whether you’re launching a new product or entering unfamiliar territory, market size analysis provides critical insight into demand levels and helps inform product development, marketing allocation, and long-term strategy.

For example:

  • Product Launches: Calculating market size before launch ensures you’re meeting sufficient demand. Market sizing methods help identify promising segments and avoid over-investment in saturated or declining categories.
  • Market Entry Strategies: When entering a new region, market size calculation clarifies opportunity scale. It enables you to design entry plans informed by economic conditions, consumer preferences, and regional competition.
  • Resource Allocation: Accurate market size estimates allow for smarter budget and resource distribution. This improves ROI by ensuring marketing and operations focus on the most viable market opportunities.

Hypothetical Example: The EV Market in the Philippines

Let’s consider a hypothetical example of market size analysis: A major global automotive brand plans to enter the electric vehicle market in the Philippines. To estimate potential revenue, the company calculates market size using both TAM and SAM. This includes evaluating urban growth, middle-class expansion, and government support for electric mobility. Market size calculation here is the foundation for evaluating commercial viability.

With insights from this market size analysis, the company focuses its entry strategy on high-opportunity urban centers for EV adoption. Targeted resource allocation—including partnerships for charging infrastructure—supports a stronger foothold in sustainable transportation, backed by precise market sizing methods.

Key Approaches to Calculating Market Size

Effective market size calculation relies on a mix of traditional methods and modern AI-driven approaches. These market sizing methods help businesses better understand potential demand and adapt to global shifts. Below, we explore key approaches used in advanced market size analysis today.

Top-Down Approach for Market Sizing

The top-down method of market sizing begins with high-level industry data—like government reports or global market estimates—and then narrows the focus to your specific target market. This market size calculation technique is useful for gauging overall potential, though it can sometimes miss local behaviors or niche demand.

AI Forecasting Models:
Modern AI forecasting tools elevate top-down market size analysis by layering in predictive analytics. These models process historical market data, competitor trends, and consumer sentiment to improve the accuracy of market size projections and future demand forecasts.

Example Scenario:
Our earlier example—the global automaker entering the EV market in the Philippines—might begin with a top-down market size calculation based on the $500 billion global EV market. By applying AI-based market sizing methods, they refine this estimate using local variables like infrastructure, preferences, and policy incentives. This dynamic market size analysis enables more responsive, localized strategy planning.

Bottom-Up Approach to Determine Market Size

The bottom-up approach to market size calculation starts at the ground level—relying on local sales data, consumer interviews, and behavioral surveys. This method offers precise, actionable insights and is especially useful for detailed market size analysis within specific segments or regions.

Predictive Analytics for Consumer Behavior:
Machine learning–driven predictive analytics enhances bottom-up market size analysis by revealing future purchasing trends based on past behavior. These tools allow businesses to scale their market size calculations with greater speed and accuracy than traditional survey methods alone.

Example Scenario:
A company exploring the plant-based food market in Japan could use real-time consumer surveys and AI-driven behavior analysis to uncover key consumption trends. These insights enhance the accuracy of market size calculations and support data-led product development aligned with emerging demand for organic and eco-friendly options.

Hybrid Approach to Market Sizing

The hybrid approach to market sizing combines top-down and bottom-up methods to provide a holistic market size analysis. By merging broad industry data with localized research, this method delivers a more complete and context-aware understanding of potential market value.

Scenario Analysis:
Scenario analysis is a vital part of advanced market size analysis. It enables businesses to model future outcomes based on changing conditions—like economic slowdowns or shifting consumer behaviors—producing a range of market size forecasts rather than relying on a static figure. This approach increases agility and reduces risk in strategic planning.

Example Scenario:
Consider a beauty brand entering China’s $60 billion beauty industry. By applying both top-down and bottom-up market sizing methods—backed by consumer surveys and market size analysis—the brand can model how variables like regulatory shifts or rising demand for cruelty-free products will shape future opportunity. Scenario analysis helps ensure the strategy is adaptive and resilient.

Steps to Calculate Potential Market Size

Accurate market size calculation depends on strong data, strategic foresight, and modern tools. These next four steps outline a structured market sizing method that senior leaders can apply to generate actionable insights and improve global market size estimates.

Step 1: Define Your Target Market with AI and Predictive Modeling

Step one in any effective market size calculation is defining your target audience. With predictive modeling, machine learning can segment audiences using real-time data and historical behavior, making your market size analysis more accurate and responsive to shifting demand.

For instance, in Japan, using AI to analyze the purchasing patterns of senior grocery buyers could reveal untapped market segments or emerging preferences, such as increased demand for organic products among older consumers.

Step 2: Analyze Market Demand Using Real-Time Data

Market size analysis based on static data can quickly become outdated. Using real-time data sources—such as digital transactions, social media behavior, or mobile app usage—gives businesses a dynamic and current view of market demand, leading to more accurate market size calculations.

Example Scenario:
In Vietnam’s fast-fashion market, brands can use real-time e-commerce data and social listening tools to improve their market size analysis. By tracking how consumers engage with fashion content online, companies can predict demand shifts, refine product offerings, and update their market size calculations with more precision.

Step 3: Identify Competitors and Leverage Competitive Intelligence

Accurate market size calculation requires more than just competitor lists—it demands active competitive intelligence. By tracking pricing, product innovation, and customer retention, businesses strengthen their market size estimates with real-world context and up-to-date intelligence.

AI-Powered Competitor Analysis:
AI-driven competitor analysis tools offer real-time alerts on new product launches, pricing shifts, and changing customer sentiment. This supports more responsive market size analysis, helping brands adapt their strategies and refine projections as competitive conditions evolve.

Example Scenario:
In Singapore’s online gaming industry, market size analysis supported by AI-based competitor tracking can reveal gaps in consumer engagement. For new entrants, this approach helps uncover underserved niches, refine positioning, and estimate market potential with greater accuracy.

Step 4: Estimate Market Value with Dynamic Forecasting Models

Traditional market sizing methods often rely on static revenue projections. In contrast, dynamic forecasting models allow brands to perform real-time market size calculations that reflect actual consumer behavior and evolving economic conditions, delivering more accurate results.

Example Scenario:
In India’s digital payments sector, market size calculation powered by AI can analyze banking access, transaction trends, and digital literacy. These models help companies forecast adoption rates, identify growth opportunities, and scale effectively based on real-time insights and evolving user behaviors.

Common Challenges in Calculating Market Size (and How to Overcome Them)

Senior decision-makers and market researchers often encounter complex hurdles during market size calculation. Fortunately, these challenges can be addressed with the right market sizing methods, tools, and a proactive research approach:

  • Data Limitations: In market size analysis, data gaps can hinder accuracy. Leveraging AI and machine learning helps fill these gaps, generate forecasts, and continuously refine datasets with real-time information, enhancing the precision of your market size calculations.
  • Rapidly Changing Conditions: To ensure robust market size calculations amidst fluctuating demand and economic shifts, invest in scenario analysis. This approach allows businesses to prepare for various future scenarios, maintaining agility in their market size analysis.
  • Regional Differences: Incorporate localized AI-driven models into your market sizing methods to account for cultural, regulatory, and economic variations across regions, ensuring more accurate market size analysis.
  • Overestimating TAM: Employ AI to dissect the Total Addressable Market (TAM) into realistic segments, facilitating more precise market size calculations and identifying truly serviceable and attainable market portions.
dining-personas

Actionable Recommendations for Market Leaders

Accurate market size calculation is an ongoing process requiring data-driven insights, predictive analytics, and strategic foresight. Implementing effective market sizing methods ensures that businesses can adapt to evolving market dynamics and maintain a competitive edge.

Leverage AI and Predictive Analytics

Integrate AI-driven tools into your market research strategy to dynamically analyze data, predict trends, and continuously refine market size calculations. Machine learning algorithms enable real-time tracking of consumer behavior, enhancing the accuracy of your market size analysis, particularly in fast-evolving sectors like technology and healthcare.

Tip: Enhance traditional market size calculations with AI by integrating real-time data, predictive analytics, and automated updates. This approach leads to more dynamic and precise market size analysis, enabling businesses to anticipate how emerging technologies might influence sectors like digital payments or shifting consumer behaviors in fast-fashion markets.

Apply Tailored Strategies for Specific Industries and Regions

Tailor your market size calculations to the specific characteristics of each industry and region. Employing appropriate market sizing methods ensures that factors like cultural nuances, economic conditions, and regulatory frameworks are accurately reflected, providing a more precise market size analysis across sectors such as technology, healthcare, and retail.

Tips for Tailoring Market Size Calculations:

  • Industry-Specific: For global brands conducting market size analysis, regional adaptation is critical. Segment your market sizing methods to reflect local consumer preferences, cultural nuances, and regulatory conditions. For instance, in India’s digital payments sector, a mobile-first approach is essential, while in the UK beauty market, demand for cruelty-free and sustainable products must shape market size calculations
  • Regional Adaptation: For global companies, segment market analysis by region and factor in local consumer preferences, regulatory conditions, and cultural nuances. For example, a mobile-first strategy may be essential in the digital payments space in India, while sustainability and cruelty-free preferences may shape the beauty market in the UK.
  • Focus on Serviceable Market Segments for Realistic Growth: Overestimating the Total Addressable Market (TAM) can result in unrealistic projections. Instead, market leaders should center their market size analysis on the Serviceable Available Market (SAM) and Serviceable Obtainable Market (SOM)—the most realistic and competitive segments to target in any market size calculation.

Tips for Targeting Serviceable Markets:

  • Narrow Market Segments: Identify narrow market segments that align with your brand’s strengths and competitive positioning. Use detailed customer personas, combined with market size analysis and AI-driven behavioral data, to focus your efforts on high-potential groups during your market sizing process.
  • Assess Market Entry Barriers: Assess competitive pressures, pricing models, and regulatory challenges to determine how much of the SAM is truly attainable. A strong market size calculation should account for these barriers. For example, companies entering the digital payments market must evaluate adoption rates and infrastructure maturity as part of their market size analysis.
  • Leverage Continuous Market Research for Agile Decision-Making: One-time market size calculations are no longer enough in fast-moving markets. Continuous market research and real-time market size analysis help brands stay agile, react to consumer behavior shifts, and capture new opportunities as they arise.

Tips for Continuous Research:

  • Adopt Real-Time Data Tools: To improve the accuracy of market size analysis, adopt tools for ongoing data collection and real-time analysis. Digital analytics platforms, AI-powered social listening, and automated surveys help track evolving consumer behavior and deliver continuous insights for more dynamic market size calculations.
  • Periodic Market Size Reviews: Schedule regular market size reviews to ensure your analysis reflects real-world changes. Periodic updates to your market size calculation, informed by dynamic forecasting models, enable brands to pivot in response to market shifts, regulatory updates, or economic disruptions.
  • Collaborate Across Departments for a Holistic View: Effective market size analysis requires input from more than just marketing or strategy teams. By involving sales, finance, product development, and operations, businesses gain a 360-degree view of market potential. This cross-functional collaboration improves both the accuracy and strategic impact of your market size calculations.

Tips for Cross-Department Collaboration:

  • Engage Sales Teams: Sales teams are on the front lines of customer interaction, making their input essential to market size analysis. Their observations on buyer behavior, demand shifts, and saturation levels help validate market size estimates and make forecasts more grounded in current conditions.
  • Collaborate with Finance: Partnering with finance ensures your market size calculation aligns with broader revenue planning. Financial analysts can help refine your market sizing assumptions and ensure growth projections are financially viable and aligned with business performance indicators.
  • Prioritize Data-Driven Decision-Making: Accurate market size analysis depends on a strong foundation of reliable data. Senior leaders should base strategic decisions on predictive analytics and documented trends, not assumptions. This data-driven approach to market sizing helps minimize resource misallocation and enables rapid strategic adjustments when conditions change.

Tips for Data-Driven Decision-Making:

  • Use Multiple Data Sources: Use a blend of primary research, secondary sources, internal sales records, and AI-driven analytics to enhance your market size calculation. A multi-source strategy provides a broader, more reliable foundation for understanding true market potential.
  • Validate Assumptions Continuously: Market size analysis is only as strong as the assumptions behind it. Continuously validate those assumptions using competitor intelligence, updated industry benchmarks, and customer feedback. This ensures that your market size estimate remains current and actionable as conditions evolve.

FAQS about Market Size Analysis

1. How to do market size analysis?

Market size analysis involves estimating the total revenue or units that can be generated within a specific market. This includes identifying the target audience, calculating total addressable market (TAM), serviceable available market (SAM), and serviceable obtainable market (SOM). Market size analysis helps businesses understand potential demand and guides investment decisions.

2. What are the 5 strategies that will determine the market size?

The five main strategies for determining market size are:

  1. Top-down analysis using industry reports
  2. Bottom-up analysis based on sales data and projections
  3. Value theory using perceived customer value
  4. Comparative benchmarking with similar products or markets
  5. Demand-side estimation through surveys or market research
    Each method offers a different lens to calculate potential market size and evaluate market opportunities.

3. What is an example of market size?

A simple example of market size: if there are 10 million potential users of a product, and each user is likely to spend $100 per year, the total market size is $1 billion annually. This estimate helps businesses assess whether the market is large enough to justify entry or expansion.

4. What is the market size in marketing analysis?

In marketing analysis, market size refers to the total volume of sales or revenue a product or service can achieve within a specific market. Understanding market size is a foundational step in building go-to-market strategies, forecasting growth, and prioritizing customer segments.

5. What are the common methods used for market size calculation?

Common methods for market size calculation include top-down analysis, bottom-up analysis, and hybrid approaches. These techniques rely on secondary research, internal sales data, customer surveys, and industry benchmarks to estimate how large a market is and how much of it a company can realistically capture.

Refine Your Market Size Strategy and Stay Ahead of the Curve

Calculating market size is no longer a static, one-time task—it’s a dynamic process that requires continuous data updates, advanced forecasting models, and AI-driven insights. Market size analysis, when done right, gives brands a strategic edge in identifying high-growth segments, planning expansion, and allocating resources more effectively.

For senior leaders and marketing strategists, investing in accurate market size calculation is essential for navigating volatile conditions, spotting opportunities early, and sustaining long-term growth.

Now is the time to sharpen your approach. At Kadence International, we specialize in helping brands conduct rigorous, data-backed market sizing tailored to local and global markets. Whether you’re entering a new region or refining your product strategy, we offer the research expertise and predictive tools you need to lead with confidence.

Partner with Kadence and turn your market size analysis into a competitive advantage. Reach out today to discover how our market research services can support your next strategic move.

There’s a reason market share remains one of the most closely watched metrics in business. It captures how much ground a brand holds—whether measured by revenue, units sold, or customer count—and turns that into a clear view of performance. Knowing how to calculate market share is not just a technical skill; it’s a strategic necessity.

Walk through any sector, from consumer goods to B2B software, and the same question echoes: who controls what share of the market? Market share analysis provides more than a snapshot of current position. It reveals shifts in competitive power, signals brand momentum, and shapes how companies position themselves to win.

The formulas are simple. Applying them well is not. Whether it’s unit-based, revenue-based, or customer-based, every market share calculation tells a different story. A single market share formula might show strong topline growth, but a segment-specific view may reveal lost ground among key buyers. The most successful marketers know how to interpret these numbers, spot the trend lines early, and act before competitors do.

Understanding how to calculate unit market share is particularly useful when revenue data is less reliable or pricing varies widely. The ability to isolate your sales performance from pricing strategies offers a cleaner picture of product traction.

Used well, market share in business is both a measure and a weapon. It guides decisions on pricing, product, expansion, and investment. Yet many companies treat it as a lagging indicator rather than a signal to act.

This guide strips it back to the core. You’ll find market share formula examples, clarity on data sources, and insight into what the numbers really mean. More importantly, it shows how to move from calculation to action—turning market share into a competitive advantage.

What is market share?

Market share refers to the percentage of total sales, revenue, or unit volume a company captures within a defined market. It’s a direct measure of how a brand stacks up against its competitors, offering a clear view of market penetration and performance over time.

In business, market share functions as both a scoreboard and a directional signal. It shows how well a company is attracting and retaining customers relative to others in the same space. Whether you’re comparing product categories, regions, or customer segments, market share in business tells you who’s leading—and who’s losing ground.

The concept gained traction in academic circles during the 20th century, particularly through the work of Edward Chamberlin. His 1933 publication Theory of Monopolistic Competition explored market power and structural competition, laying early groundwork for the use of market share analysis as a tool for understanding business dynamics.

Today, market share analysis is essential for marketers, strategists, and investors. It enables meaningful comparisons, identifies areas of opportunity, and supports smarter decision-making. Market share calculation is often the first step in diagnosing competitive strength, whether through a revenue-based formula or a closer look at how to calculate unit market share in volume-driven categories.

The metric is simple in theory but revealing in practice. A single market share formula—when applied to real-world data—can unlock insight into product appeal, pricing power, and strategic gaps. This is why the calculation of market share remains central to understanding both brand performance and broader industry trends.

Methods for Calculating Market Share

Understanding how to calculate market share begins with selecting the right approach. Depending on available data, companies may use a unit-based, revenue-based, or customer-based method. Each market share formula offers a different angle—and together, they provide a more complete picture of competitive position.

Unit-Based Market Share

One of the most straightforward ways to conduct a market share calculation is by comparing units sold. This approach is especially useful when pricing varies across competitors or when sales volume is a better indicator of market influence. The formula for unit-based market share is:

Unit-Based Market Share = (Company’s Units Sold / Total Market Units Sold) x 100

For example, if a company sells 5,000 units in a market where 20,000 units are sold in total, the unit-based market share is (5,000 / 20,000) × 100 = 25%. Knowing how to calculate unit market share is critical in categories where volume signals demand, such as FMCG or hardware.

beauty-trends

Revenue-Based Market Share

Another common market share formula relies on sales revenue. This method is helpful when assessing brand value or pricing strength in the market. It’s frequently used in industries where price positioning is part of the competitive strategy. The formula is:

Revenue-Based Market Share = (Company’s Revenue / Total Market Revenue) x 100

If a brand earns $1 million in a market worth $5 million, the revenue market share is ($1 million / $5 million) × 100 = 20%. This version of the market share calculation highlights financial performance relative to competitors.

Customer-Based Market Share

Customer-based market share analysis compares the number of customers a company has to the total in the market. It can offer insight into brand loyalty, retention, and competitive reach—especially in sectors where relationships drive repeat business. The formula is:

Customer-Based Market Share = (Company’s Customers / Total Market Customers) x 100

For instance, if a company serves 500 customers in a market of 2,500, its customer-based market share is (500 / 2,500) × 100 = 20%.

Each market share formula offers a lens into different aspects of business performance. Used together, these methods give depth to market share analysis and help identify whether growth is coming from volume, pricing, or customer acquisition.

Accurate data is essential. Every market share calculation depends on solid inputs—from market research reports and internal sales data to customer surveys and third-party benchmarks. The more reliable the data, the more useful the insights.

Gathering Market Data for Market Share Analysis

Reliable data is the foundation of any accurate market share calculation. To understand a company’s position clearly, marketers must draw from a range of sources. Each data type offers a different lens on market dynamics and contributes to a more complete view of performance.

Market Research Reports

Third-party market research reports are often the starting point for market share analysis. These reports, published by independent firms, offer critical information on market size, growth trajectories, customer trends, and competitive landscapes. Used well, they help define total addressable markets and identify where a company fits. For any business aiming to learn how to calculate market share at an industry level, these insights are indispensable.

Sales Data

Internal sales data is central to market share calculation. This includes units sold, revenue by product line, and breakdowns by geography or channel. On its own, this data can’t reveal competitive standing—but when combined with external figures, it becomes the basis for understanding how much share a company controls. Whether the goal is to track unit-based share or calculate revenue market share, clean, timely internal data is essential.

Customer Surveys

Customer surveys provide a view that sales numbers alone cannot. By gathering feedback on preferences, loyalty, and brand perceptions, surveys help companies understand their position from the buyer’s perspective. This type of input supports customer-based market share metrics and adds depth to segment-level market share analysis. It also helps validate assumptions about target audiences and competitive strengths.

Industry Data and Benchmarks

Trade associations, regulatory bodies, and government databases offer valuable industry benchmarks. These sources can contextualize a company’s performance and reveal how it compares to category averages. In market share analysis, benchmark data helps clarify whether performance is strong or underwhelming relative to broader trends. These figures are often used when estimating total market sales or verifying assumptions used in market share formulas.

Gathering accurate market data isn’t a one-time task. For companies committed to improving how they calculate market share and interpret results, ongoing access to diverse, trustworthy sources is non-negotiable.

Ensuring Data Accuracy for Market Share Calculation

The strength of any market share calculation depends on the quality of the data behind it. Even the most precise market share formula will fall short if the inputs are flawed. When conducting market share analysis, accuracy and reliability must take priority.

Source Credibility

The foundation of any reliable market share metric is the credibility of the source. Data from established research firms, well-known industry publications, and verified providers reduces the risk of misinterpretation. These sources are more likely to maintain consistent methodologies and provide unbiased insights, which are critical when calculating market share and comparing performance across competitors.

Sample Representativeness

If your data is drawn from surveys or custom research, it must reflect the actual market. A representative sample ensures that findings can be applied to the broader population. In market share analysis, a skewed sample can distort your understanding of customer preferences, competitor reach, or segment penetration. Whether the goal is to understand unit market share or customer-based performance, sample accuracy is non-negotiable.

Data Validation

Triangulation—verifying findings across multiple independent sources—is a proven method for improving accuracy. Cross-referencing internal sales data with third-party reports or benchmarking against industry estimates strengthens confidence in the results. This process is especially important when estimating total market size or identifying the right denominator in any market share formula.

Data Privacy and Compliance

Accurate data collection must also respect legal boundaries. Compliance with data privacy regulations, including customer consent and anonymity, is essential. Whether the inputs come from survey data, CRM systems, or external panels, maintaining ethical standards protects both the brand and the integrity of the analysis.

Getting market share analysis right begins long before the formula is applied. It starts with data that is not only complete, but credible, representative, and responsibly sourced.

How to Calculate Overall and Segment-Specific Market Share

Understanding how to calculate market share is essential for any brand looking to benchmark performance, assess competitive standing, or identify opportunities for growth. Whether your aim is to determine overall market share or drill into specific product categories, the method follows a similar structure—what changes is the scope.

Calculating Overall Market Share

The market share formula begins with a clear definition of the total market and an accurate measure of a company’s contribution to it. This high-level metric reveals how much ground a company controls within its category and is one of the clearest indicators of competitive power.

Step 1: Define the Total Market Size

Start with the big picture. Total market size refers to the combined sales, revenue, or units sold by all companies within the industry over a defined period. Depending on the category, this may include public data, analyst forecasts, or proprietary estimates. Market research reports and industry sources are typically used here. A credible baseline is critical for any meaningful market share calculation.

Step 2: Determine Your Company’s Sales

Next, gather internal data for the same time frame. This includes total revenue, units sold, or customer count, depending on how you plan to measure market share. The data should match the structure of the total market figure—revenue-to-revenue, units-to-units. This internal benchmark is what you’ll use in the next step of the market share formula.

Step 3: Estimate Competitors’ Sales

Few companies disclose full performance data, so estimating competitor figures is often necessary. Trade publications, industry databases, analyst reports, and even investor presentations can offer approximations. While the numbers may not be exact, triangulating multiple sources will give you a reliable view of where your company stands. Market share analysis does not require precision down to the decimal—it requires credible directional data.

Step 4: Apply the Market Share Formula

With your company’s sales and the total market size in hand, apply the formula:

Overall Market Share = (Company Sales / Total Market Sales) × 100

For example, if your company generated $10 million in sales and the overall market was valued at $100 million, your overall market share is (10 ÷ 100) × 100 = 10%.

This market share calculation provides a baseline view. But the real value comes from analyzing changes over time and comparing your figures with those of key competitors. Market share trends can highlight periods of growth or stagnation, reveal gaps in customer acquisition, or pinpoint threats from new entrants.

While useful at a macro level, overall market share only tells part of the story. For a more nuanced view, brands must also examine how they perform within distinct segments of the market.

Calculating Segment-Specific Market Share

Segment-specific market share analysis breaks down your performance within defined customer groups, regions, or product categories. It allows you to assess how well you’re serving your most important audiences—and where strategic shifts might be needed.

Step 1: Define Relevant Market Segments

Begin by identifying the segments that matter most to your business. These could be based on demographics, location, product attributes, channel type, or behavioral traits. The key is to choose segments that align with your growth strategy and where meaningful differentiation is possible.

Step 2: Gather Segment-Level Sales Data

Once segments are defined, collect data on your performance in each one. This may include revenue, units sold, or customer acquisition figures specific to each segment. At the same time, look for external data on total segment size. Market research firms often break out these figures in their reports. Accurate segment data is the foundation for reliable market share analysis at a granular level.

Step 3: Use the Segment Market Share Formula

The process mirrors the overall market share calculation:

Segment Market Share = (Company Segment Sales / Total Segment Sales) × 100

For instance, if your company generated $2 million in revenue from a segment worth $10 million, your share is (2 ÷ 10) × 100 = 20%.

Run this calculation across multiple segments to get a full performance map. You may discover that while your overall market share is steady, you are losing ground in high-value niches or gaining traction in emerging customer groups.

Step 4: Analyze and Act on the Results

Segment-specific market share provides deeper insight than topline figures alone. A high share within a priority segment confirms that your positioning and offer are resonating. A lower share may indicate missed opportunities, gaps in product-market fit, or execution issues in distribution or messaging.

These insights allow for sharper targeting, better product alignment, and smarter resource allocation. From marketing and sales to product development and pricing, segment-level performance should shape your strategic priorities.

Segment-level analysis is especially important in complex or mature markets where broad averages mask variability. In categories with strong regional differences or wide consumer diversity, the ability to calculate segment-specific market share is a distinct advantage.

Interpreting Market Share Results

Market share analysis doesn’t end with a calculation. The real value lies in interpretation—understanding what those figures reveal about competitive position, brand momentum, and strategic direction. Used correctly, market share becomes a tool for insight, not just measurement.

Benchmarking for Context

One of the most effective ways to interpret market share results is by benchmarking. This means comparing a company’s current share against competitors, industry norms, or its own historical performance. Benchmarking identifies whether gains are significant or merely keeping pace with overall market growth. A company growing in absolute terms may still be losing ground if the market is expanding faster.

Comparing market share to peer companies also provides clarity. If a brand holds 15% of the market but the category leader holds 40%, the gap is strategic, not marginal. This difference may highlight weaknesses in distribution, pricing, or product relevance—factors that benchmarking helps expose.

Industry Averages and Baselines

Industry averages act as valuable reference points. When a company’s market share is well above the average, it typically reflects strong positioning, customer loyalty, or effective go-to-market execution. A share below the average may point to issues in visibility, differentiation, or resource allocation. While averages don’t tell the full story, they establish a meaningful baseline for performance evaluation.

Tracking Trends Over Time

Interpreting market share figures in isolation offers limited insight. True value comes from tracking market share trends over time. This helps marketers understand whether the brand is gaining traction, holding steady, or falling behind. Even modest changes in share can signal shifts in consumer behavior, competitive activity, or the effectiveness of recent campaigns. A flat line in a growing market suggests loss of relevance; a rising share during a downturn may signal resilience or strategic agility.

Segment-Specific Market Share Analysis

Looking at overall market share can obscure critical details. Segment-specific market share analysis breaks down performance by product type, customer group, or geographic region. A brand might lead in one region but trail nationally. Segment-level analysis highlights where growth is happening and where reinvestment or repositioning may be needed. It also identifies which audiences are most responsive, allowing for smarter targeting and refined messaging.

The Competitive Landscape

Understanding your market share is only part of the picture. Understanding it within the competitive landscape completes it. Analyzing competitor strategies and market share shifts helps identify threats and opportunities. If a competitor’s share is growing faster, something in their model is working. Market share analysis, when combined with competitor intelligence, sharpens positioning and informs strategic moves.

Interpreting market share results is where numbers turn into decisions. It is here that growth strategies are tested, weaknesses are exposed, and new directions are set.

Leveraging Market Share Insights

Market share analysis is not an abstract exercise. It is a practical tool that informs strategic direction, drives decision-making, and anchors business goals in measurable outcomes. When interpreted well, market share insights become a competitive advantage—one that influences nearly every function of a business.

Strategic Marketing

Market share insights help sharpen marketing strategies. By studying shifts in share across time periods or segments, marketers can pinpoint what’s working and where demand is falling short. These insights guide campaign planning, message development, and audience targeting. A declining share may indicate brand fatigue or ineffective positioning. A rising share might confirm that a new channel strategy or pricing model is gaining traction.

For companies aiming to grow, knowing how to calculate market share at the category or subcategory level is critical. Brands with a smaller share often pursue market penetration tactics to increase awareness and acquisition. Those with a strong foothold typically focus on defending territory through loyalty-building, differentiation, or product bundling. Either way, market share analysis clarifies where to focus—and why.

Product Development and Innovation

Effective product development depends on knowing what the market wants and where the gaps lie. Market share trends, especially when tracked by segment, help uncover unmet needs or emerging demand. A lagging share in one product line may signal the need for improvement or reinvention. Strong share growth can validate new launches and guide feature prioritization.

Companies that apply market share insights early in the development cycle reduce guesswork. They design with demand in mind and use market share calculation methods to track impact post-launch. This creates a direct feedback loop between market performance and product decisions.

Competitive Positioning

A brand’s market share is often the clearest indicator of its standing in the category. Market share insights allow for precise comparisons with key competitors—by product, region, or customer type. This analysis supports competitive positioning by highlighting where a company leads and where it lags.

Whether the opportunity lies in pricing, packaging, or service delivery, understanding relative performance is key to defining a strategy that stands out. Market share analysis reveals where differentiation efforts are landing and where they’re being drowned out.

Resource Allocation

Resource planning becomes more targeted when grounded in market share metrics. Marketing, sales, and product teams can prioritize high-growth segments or underperforming categories with clarity. Market share analysis helps businesses avoid overinvestment in mature or declining segments, while ensuring the most promising areas are fully supported.

Competitive Intelligence

Tracking competitors’ market share over time adds depth to standard competitive intelligence. It shows who is gaining ground, who is plateauing, and which strategies are changing the landscape. These insights influence everything from pricing strategy to partnership decisions.

Market share insights, when fully leveraged, don’t just describe the market—they shape the response.

keeping-up-with-Gen-z

Challenges and Limitations in Market Share Analysis

Like any business metric, market share is only as useful as the data and methods behind it. While the market share formula itself is straightforward, the process of calculating market share often comes with limitations that can affect accuracy, interpretation, and strategic value. Acknowledging these challenges is key to ensuring that market share analysis remains relevant and reliable.

Data Limitations

The most common challenge in calculating market share is obtaining complete and accurate data. Companies often struggle to find verified figures for total market size, competitor sales, or even their own segment-specific volumes. Without reliable data inputs, the entire market share formula can lead to distorted conclusions.

Gaps are especially common when trying to estimate competitors’ sales. This information is rarely public, particularly in fragmented or privately held markets. In these cases, marketers can turn to a combination of industry reports, analyst estimates, and internal sales team intelligence to approximate totals. While not perfect, triangulating these sources often produces a usable figure for market share calculation.

Working with market research agencies can help fill these gaps. These firms often have access to proprietary databases and benchmarking tools that provide more accurate estimates than what’s publicly available. Their expertise in validating and sourcing market data adds a level of reliability that informal estimates may lack.

Evolving Market Dynamics

Markets don’t stand still. Technological disruption, economic volatility, and changing consumer behavior can all influence the accuracy of market share analysis. A market that was stable last year may have been reshaped by new entrants, shifting preferences, or regulatory changes.

To keep market share calculations relevant, marketers must update data sources regularly and remain responsive to market movements. Outdated data leads to misleading results, especially when used to guide decisions around pricing, investment, or positioning.

Competitor Visibility

Limited visibility into competitor performance is another obstacle. Without access to rivals’ revenue or unit sales, marketers must rely on indirect signals. Trade publications, investor briefings, and customer research can offer clues, but interpreting them requires caution.

Competitive intelligence teams can help close these gaps by tracking share of voice, customer sentiment, and pricing shifts. These inputs won’t replace hard numbers, but they can support a more complete view of the competitive landscape.

Data Accuracy and Validation

Even with data in hand, accuracy remains a concern. Poorly sourced or inconsistently structured inputs can undermine the credibility of a market share analysis. Validation steps—such as cross-checking multiple sources, using consistent time frames, and conducting regular audits—are essential. Partnering with agencies that uphold high standards in data methodology ensures that decisions based on market share are grounded in fact, not assumption.

Market Share vs. Profitability

While market share is a valuable metric, it does not reflect profitability. A company may hold a large share of the market yet operate on thin margins or incur high acquisition costs. In contrast, a smaller competitor may run a leaner operation and deliver stronger financial returns.

To evaluate business performance effectively, market share analysis must be viewed alongside other metrics. Profit margins, return on investment, cash flow, and revenue growth all provide essential context. Focusing solely on increasing market share without regard to profitability can lead to overextension or unsustainable pricing strategies.

The most effective approach balances both goals. Brands that align their market share objectives with long-term financial performance are better positioned for sustainable growth. Marketers and strategists should ensure that share gains translate into meaningful business outcomes—not just visibility, but value. Understanding this balance is key to making market share insights truly actionable.

Working with a Market Research Agency

Accurate market share analysis relies on more than formulas. It demands robust data, careful interpretation, and a deep understanding of market forces. Partnering with a market research agency can elevate each of these elements—bringing clarity to complexity and turning metrics into strategic direction.

Expertise and Specialization

Market research agencies bring a level of specialization that most internal teams cannot replicate. Their understanding of market structures, sampling strategies, and analytical frameworks ensures that market share calculations are not only correct, but relevant. These teams know how to navigate fragmented markets, inconsistent datasets, and evolving customer segments. By working with a research partner, marketers gain access to refined methodologies that yield stronger, more actionable insights.

Access to Deeper Data

Agencies often have access to proprietary data sources that individual companies do not. This includes industry-specific benchmarks, third-party panels, category-level sales trackers, and historical trend databases. For companies trying to estimate total market size or competitor performance, these sources are often the missing piece. Incorporating this depth into market share analysis improves accuracy and broadens the lens through which performance is assessed.

Strategic Industry Context

A credible market share analysis is never built in isolation. Research agencies bring market context—knowledge of adjacent trends, competitor activity, regulatory shifts, and emerging technologies—that shapes how the data is interpreted. They help explain not just what the numbers say, but why they’re shifting and where they might go next. This perspective is especially valuable when interpreting market share changes across segments or time periods.

Rigorous Data Collection and Analysis

From survey design to statistical modelling, agencies apply rigorous techniques to ensure data reliability. Their processes include vetting respondents, testing for bias, and validating results across multiple sources. This level of scrutiny reduces the risk of errors and increases confidence in the conclusions. When the goal is to guide investment or repositioning, that level of precision matters.

Tailored Insights and Deliverables

Effective agencies don’t just deliver data—they translate it. Whether through interactive dashboards, customized reports, or executive-ready summaries, they package findings in a way that fits decision-making workflows. This ensures that market share insights don’t get lost in translation, but instead drive action at the right level.

For brands seeking clarity in a shifting market, the right research partner adds more than just data. They add direction.

Continuous Monitoring and Updates

Market share analysis is not a one-off task. In a fast-moving market, accuracy depends on consistency. Tracking market share trends over time allows businesses to remain proactive rather than reactive—adjusting strategies before problems emerge or opportunities pass.

Market Share Monitoring for Ongoing Performance

Regular market share monitoring reveals how brand performance evolves in relation to competitors and market shifts. Changes in share often signal broader dynamics—consumer preference changes, price shifts, or supply disruptions. Without frequent updates, businesses risk acting on outdated insights.

By reviewing data at regular intervals—monthly, quarterly, or aligned with campaign cycles—marketers gain an early read on what’s working and where adjustments are needed. Continuous tracking also builds internal alignment, helping teams respond quickly to changes in market position.

Using Trend Analysis to Guide Strategy

Long-term market share trends tell a more complete story than snapshots. Identifying patterns over time allows marketers to evaluate the lasting impact of strategic decisions. Did a new pricing model move the needle? Has a rebrand affected customer retention in key segments?

This type of market share analysis helps marketers prioritize with confidence. It also enables better forecasting by grounding future decisions in real-world performance data rather than assumptions.

Competitor Benchmarking as a Strategic Tool

Benchmarking against competitors is essential for understanding relative performance. Monitoring competitor market share over time uncovers more than positioning—it shows momentum. If a rival is gaining share quickly in a segment you’ve deprioritized, it might be time to reevaluate.

Competitor benchmarking also highlights areas of strength. It can validate a leadership position or confirm the success of a differentiation strategy. When used effectively, it supports resource allocation, campaign messaging, and sales enablement.

Timely, Actionable Reporting

Effective market share tracking requires access to timely, digestible reporting. Market research agencies help fill this gap by delivering customized dashboards and trend reports that translate raw data into business-ready insights.

These deliverables offer clarity on where gains are being made, where share is slipping, and what needs attention. They allow leadership teams to make decisions with speed and confidence—based on real-time market share data rather than outdated models.

Custom Solutions for Dynamic Markets

No two businesses face the same market dynamics. Research agencies offer tailored solutions designed around the specific tracking needs of each brand—whether that’s ongoing segment analysis, competitive benchmarking, or executive-ready summaries.

Staying competitive means staying current. Brands that invest in continuous market share monitoring, strategic trend analysis, and competitor benchmarking gain a significant edge—one grounded in data, not guesswork.

FAQs About Market Share

What is the formula for calculating market share?

The standard market share formula is:
Market Share = (Company’s Sales / Total Market Sales) × 100

You can calculate market share using revenue, units sold, or customer count depending on the business context. This formula gives the company’s percentage of total sales in a defined market.

How do you calculate market per share?

The term market per share is likely a misstatement of market share. To calculate market share, divide your company’s sales by the total sales in the market, then multiply by 100 to get a percentage.
Example: If your company made $2 million in a $10 million market, your market share is 20%.

What does 80% market share mean?

An 80% market share means one company accounts for 80% of all sales within a given market. This level of dominance is rare and often indicates a monopoly or a heavily consolidated industry. It reflects strong brand control, limited competition, or high barriers to entry.

What does 25% market share mean?

A 25% market share means the company holds one-quarter of total market sales. This is typically considered a strong position, especially in competitive or fragmented markets. It suggests significant brand presence and customer reach, though still leaves room for competitors to challenge that position.

Why Market Share Analysis Still Matters

Market share remains one of the most practical metrics for assessing business performance. It offers a real-time view of how a brand stacks up against competitors, where it’s gaining ground, and where it’s falling behind. When used effectively, market share analysis informs strategy, sharpens positioning, and drives decisions grounded in evidence.

Calculating market share is only the beginning. The value lies in what companies do next—interpreting trends, benchmarking against rivals, and reallocating resources to where growth is most achievable. This process requires precision, reliable data, and consistent tracking. It’s not a one-time effort but an ongoing discipline.

Working with a market research agency adds depth and rigor to this process. With access to proprietary data, validated methodologies, and deep sector knowledge, the right partner helps businesses go beyond surface-level metrics. Market share becomes more than a percentage—it becomes a strategic tool.

But market share alone isn’t the end goal. Strong financials, customer retention, brand relevance, and innovation must all be measured alongside it. Sustainable growth comes from understanding how market share supports broader performance—not just claiming space, but building value within it.

As markets shift, so must strategy. Businesses that monitor market share regularly, respond to competitive movements, and make decisions based on real-time analysis are more likely to outpace their peers. This is where tools, process, and partnership converge.

At Kadence International, we deliver the market intelligence that drives confident decision-making. We go beyond data collection to deliver clarity—helping brands understand where they stand, where the market is headed, and how to act on it. If you’re ready to strengthen your position with precise, actionable insights, we’re ready to help.

Don’t navigate in the dark. Move with certainty. Let Kadence elevate your market share analysis.

Stay ahead

Get regular insights

Keep up to date with the latest insights from our research as well as all our company news in our free monthly newsletter.

It makes sense to open up new markets for a successful product or service. But how do you know whether it’s worth the investment? What makes for a potential buyer in your home territory might not apply in a new location where the total addressable market could be much smaller or many times the size. Enter the market researchers. We explain how to calculate market potential of a product or service.

Estimating sales can be a chore even when you have historical and well-honed market instincts to work with. But in a new market this is even harder. There’s no historical data to review and it’s challenging to estimate the kinds of expenses and risks that might crop up.

An inability to judge sales makes the decision of whether to enter a new market much harder. Without a decent estimate – of both sales and likely profits – it’s almost impossible to decide on how you might enter and what kind of investment to make there.

What’s the market really worth?

The starting point is to get a handle on the existing market for your brand or product in the new territory. A basic market analysis is a great starting point. Typically it breaks down into:

  • Market sizing (current and future)
  • Market trends
  • Market growth rate
  • Market profitability
  • Industry cost structure
  • Distribution channels
  • Key success factors

But within each category, there’s lots to research. A more superficial look at the data can be helpful for a ‘first cut’ look at which new markets you might want to enter. But a deeper dive into the numbers will be essential if you’re going to properly evaluate the strategy for what looks like a high-probability candidate.

That more sophisticated analysis could take the form of a total addressable market (TAM) analysis. This looks at both the TAM itself, as well as serviceable available market (SAM). This is the portion of TAM that your company’s products or services play inside; and serviceable obtainable market (SOM), the percentage of SAM which your might realistically reach.

Best guesses?

But getting to SOM for a brand new market isn’t a simple calculation. It’s not exactly easy in markets where you’re a known quantity and understand the competitive environment, either! For businesses in mature categories and with previous experience of being a new entrant to markets, it’s possible to make educated guesses. This can be refined with local research on factors that might shape consumer behavior.

In some industries that data might be possible to obtain – from industry associations, for example, or government agencies. In others – and particularly in product segments that a relatively underdeveloped in the market you plan to enter – sales figures might be harder to come by.

Then there’s the difficulty of calculating market share. You will know what it might cost in contracts, infrastructure and marketing to build share in existing markets. But the assumptions may be way off-base for a brand new market.

Stay ahead

Get regular insights

Keep up to date with the latest insights from our research as well as all our company news in our free monthly newsletter.

Talk to people

At this point there are two avenues:

Research sales results that have been achieved by other companies like yours. They don’t even need to be in precisely the same line of business. The lessons of other companies looking to sell into the new markets can reveal both the optimum routes in, the barriers to adoption and the appetite for new brands.

That might even mean contacting other businesses to ask their experience of making the adaptation to the new market – as well as learning about potentially important busy and slow seasons, noteworthy business practices and quirks of the system that might not have a direct bearing on the size of the opportunity, but will allow you to adjust your assumptions.

Talking to local partners, however, is probably the best way of calibrating your expectations. Even if you plan to enter a market by establishing a local entity and investing in your own facilities and marketing, you’ll still be working with many different counterparties. This can span everything from local professional services firms such as lawyers and accountants, to warehousing, distribution or media buying agencies.

They ought to be able to offer anecdotal evidence at the very least; at best, they’ll have insights into the size of the market and chances of capturing that crucial market share. And if the route to market entry is contracting with a local distributor, licensees or franchisees, their sense of the opportunity could be invaluable.

But above all, rigorous quantitative and qualitative market research will reveal a great deal about attitudes and appetites for your brand or product. The more you can contextualize the hard data on existing spend and potential market growth with consumer insight, the more realistic your evaluation will be.

Focusing on behavior

One other way to address uncertainties about how a new market might embrace a product or service is to think not about that category, or even look at domestic rivals’ sales and strengths. It’s to create a strategy based on consumer behaviors.

If you can analyze why your brand, product or service is successful in its existing markets and break down the results into some key motivators or even behavioral traits of your consumers, it might be possible to assess where those traits are visible in a new market before you enter. In what situations is your product used? What type of people love it? What are those customers’ attitudes across different domains? What role does it play in their lives – and why?

That will require some pretty deep insight into the market you want to enter. Clearly it’s a more useful investment to make if there are other positive signals to encourage you in – fundamentals such as infrastructure, spending power or pre-existing local interest in your brand or product.

How good is your cost analysis?

Knowing your potential sales, market share and growth are all important. But the scale of the opportunity isn’t just sales – it’s profit. And even seasoned businesspeople can misstep when it comes to keeping costs under control in their market entry strategy. Here’s a brief list of costs that won’t affect domestic-only businesses:

  • Shipping costs – which can also fluctuate wildly, as we’re finding out during the COVID-19 pandemic. Consider, also, capacity. Shipping out of markets with a high balance of trade deficit (Europe, US, UK) to major exporters (China, for example) is much easier than going the other way.
  • Legal expenses – from registering a business in a new location, sorting out licensing, contracts, the right insurance cover… and complying with local regulations on everything from product labelling to anti-bribery laws.
  • Foreign taxes – and other local accounting quirks, which might be different depending on your headquarters domicile and the mode of entry into the market.
  • Translation services – for everything from contracts and technical specs, to instruction manuals and marketing.
  • Recruitment and HR – even a light-touch market entry will benefit from putting some employees into the new market to oversee set-up and manage local relationships.
  • Travel expenses – for the above, but also for ongoing check-ins with local teams or business partners.

What do you know about rivals?

Some lucky businesses will find an overseas market where there are few local rivals, legal and business structures that allow them to port across their defensive attributes from existing markets and a ready but as-yet-untapped consumer base. But those will be rare. So to properly understand the market potential, you’ll need competitor analysis. Our typical approach to this considers:

  • Who are your rivals in that market? Not just currently selling what you want to sell, but addressing your potential customers, too.
  • What is their range of products? How easily might they change?
  • How do they pitch their consumers? What messages are they using? Which channels?
  • What is their competitive advantage? What’s their cost base like? What could you replicate – and where can you out-compete them?
  • What’s their market share? How fragmented in the competition? What opportunities does that present either in terms of the industry cost-base or even acquiring smaller rivals?
  • What is their company structure? If they outsource (for supply or support) or license (to address the market), could those be vulnerabilities increasing your potential strength?

In summary

A lack of prior experience and knowledge can make it challenging for companies to assess the potential of new markets. We help lots of business overcome this – not just through the use of primary and secondary market research, but also by having people on the ground in many countries and regions to add specific local knowledge.

This creates a much more rounded view of the market potential – and the optimum ways to tap into it – than simply applying a cookie-cutter approach to market entry. The key steps:

  • Understand the demographic and economic drivers that underpin the total market for your products or services.
  • Think laterally about the broader factors – such as the types of consumer and cultural attitudes – that dictate market size.
  • Analyze existing market activity to deduce a TAM, SOM and SAM.
  • Conduct consumer research to evaluate your specific opportunity in the market.
  • Competitor intelligence will help you test assumptions about potential market share gains.
  • Rigorous local insights into costs and risks will reveal the profit potential – the ultimate rationale for market entry

Find out more about our market entry services, read our expert guide to market entry or get in touch with us to discuss a project with our team.

Market size is a term that gets thrown around a lot in the business world — but what does it actually mean, and why does it matter?

Despite being a fundamental concept, market size is often misunderstood. Confusion around what it really represents can lead to poor strategic decisions, missed opportunities, or wasted resources chasing markets that don’t exist.

As someone who’s worked with businesses across different stages — from startups to established enterprises — I’ve seen firsthand how accurately sizing your market can be a game-changer. It gives you a clearer path to growth, helps attract the right investors, and prevents you from investing in dead-end strategies.

In this article, we’ll unpack what market size actually is, how to calculate it properly, and how to distinguish it from related concepts like market share, TAM, SAM, and SOM — so you can make decisions based on real opportunity, not guesswork.

What is market size?

At its core, market size refers to the total number of potential buyers for your product or service. It’s a critical metric that helps businesses understand the commercial opportunity within a specific market.

One of the most common misconceptions about market size is confusing it with the overall population of a country or region. Just because a market has a large population doesn’t mean it’s the right fit. In fact, targeting a high-density market without enough alignment to your ideal customer profile can be a costly mistake. A smaller market with more qualified, interested buyers is often a better strategic choice.

Alexa defines market size as “the number of individuals in a certain market segment who are potential buyers.” That’s a useful starting point, but in practical terms, market size is more than just headcount — it’s typically measured as:

  • The total number of potential customers or sales within a defined period (usually a year), or
  • The total potential revenue your business could generate from that market in that time frame.

Understanding this figure sets the foundation for everything from product development to marketing, sales forecasting, and investment planning.

Why is market size important?

Understanding the size of your market — whether existing or new — is essential for making smart, strategic decisions.

If your sales growth is stagnating or has plateaued, market size might be the reason. There’s little point in continuing to invest heavily in a market where your target audience is shrinking or already saturated. On the flip side, entering a new market without knowing how many real potential buyers exist can lead to underperformance, missed targets, or a failed product launch — costing you time, money, and momentum.

When done properly, market sizing helps de-risk your decisions. It gives you a clear picture of the opportunity ahead and enables you to prioritise the markets that are most likely to deliver ROI.

It also plays a critical role in shaping:

  • Pricing and distribution strategies
  • Product-market fit validation
  • Marketing campaigns and positioning
  • Sales forecasting and capacity planning

In short, market size is more than a number — it’s the foundation for strategic planning, especially when growth, expansion, or investment is on the table.

Key Reasons to Understand Your Market Size

  • Attracting Investment
    Market size is one of the first things investors look at. It shows the potential upside. If you can demonstrate a large, reachable, and growing market, you’re in a much better position to secure funding.
  • Building a Strong Go-to-Market Strategy
    Knowing how many potential customers exist — and where — helps you define your positioning, messaging, and marketing mix with confidence.
  • Forecasting Budget and Headcount
    Growth potential ties directly into resourcing. With solid market size data, you can make better decisions around budgeting, team structure, and scaling operations.
  • Maximising Your R&D Spend
    When you understand who your customers are and how big the opportunity is, you can focus your product development on solving the right problems — for the right people — instead of building features no one needs.
Stay ahead

Get regular insights

Keep up to date with the latest insights from our research as well as all our company news in our free monthly newsletter.

How to determine market size

So how do you actually figure out your market size? There are a number of ways to go about this:

  • Clearly identify the target market for your product or service
  • Carry out market research to assess the level of interest in what you’re offering — will people buy it?
  • Gather data on the number of potential customers and transactions per year. There are a number of secondary resources you can consult to help you do this.
  • Assess the total revenue generated in that segment of the economy in a given year

Is your market size too small?

So — you’ve calculated your market size, but what does that number mean? How do you know if your business is worth pursuing?

The answer depends very much on the market and the size of your business, but there are some good general guidelines. Usually, $100 million is on the lower end, and if your market size is smaller than this it may prove difficult to convince stakeholders or investors to get on board.

What is the serviceable obtainable market?

Determining your total market size is only the beginning, and this information alone isn’t worth much.

This is because you’ll never be able to reach literally every potential customer. There’s just no way. No business has the marketing tools, scale, and budget to reach every single person in their market.

And that’s without even mentioning competitors. You’ll never corner an entire market, and the most you can hope for is usually a small slice. According to Tx Zhuo of Karlin Ventures “If it’s 1 to 5 percent of the pie, you have a realistic plan.”

This is where we can turn to a useful metric called serviceable obtainable market (SOM). This refers to the potential customers (and potential revenue) you can realistically hope to reach with your marketing tools and budget.

So how can you calculate your SOM?

How to calculate the serviceable obtainable market

There are a number of ways to calculate your SOM. According to Jared Sleeper, an investor in early-stage companies, there are three main approaches you can take.

  1. Top-down. This approach relies on the predictions, forecasts, and assumptions about your market from analysts like Gartner. It’s often based on conjecture and estimates to some extent. Think of statements like: “The wireless headset market is forecast to reach $2.5 billion by 2023”. It’s good for a general overview of the situation, but it’s a little vague and can be challenging to understand what proportion of the market you can realistically corner. 
  1. Bottom-up. This involves starting with your price and how many units you can realistically expect to sell. How many customers can you reach + how much is each sale = your SOM. It’s more tailored to your specific situation instead of just a broad assessment of the market as a whole, so in this sense, it’s a more reliable way to work out your SOM.
  1. Value theory. This final strategy is a little less precise, but it still has some usefulness. It involves considering the value your product or service adds compared to alternatives and estimating how much customers would be prepared to pay for that extra value.

Sleeper recommends options 2 and 3 since they actually consider the specifics of your business and how you would interact with the market, as opposed to a general prediction. It may make sense to use a blend of all three approaches to gain the fullest picture of your SOM and provide as much insight as possible to your stakeholders or investors.

Calculating market size is an important step on the road to building a successful business or launching a new product or service. However, it’s only one step. The metric on its own isn’t worth a whole lot unless you can also show how much of that market you can reach and compete for.


Market research is a crucial part of determining your market size, SOM, and laying the foundations for a successful business. To find out how Kadence can help you with this, take a look at our market sizing services or get in touch with us today.

How do you calculate your market size and the serviceable obtainable market??

This is a crucial part of any business plan, allowing you to gain a clear idea of how many customers you can potentially reach and how much revenue you can generate. This allows you to make more concrete plans and secure budget and buy-in from key stakeholders..

Top-down market sizing is one of the two main methods we can use to calculate the serviceable obtainable market.  In this article, we’ll take a look at what top-down market sizing involves, how you can use it in your own business, and the strengths and weaknesses of this approach.

What is top-down market sizing?

When we calculate our serviceable obtainable market, there are two main ways to approach the calculation: top-down and bottom-up.

  • Top-down market sizing starts by looking at the current market as a whole, taking a macro view of all the potential customers and revenue, and then narrowing it down to a section you can realistically target. This gives you your serviceable obtainable market, (SAM).
  • Bottom-up market sizing, on the other hand, is where you start with your own product and the basic units of your business and work out how you can scale them. Where can your products be sold, how much for, and how much of the current market could you command? You start small and build up to the result.

What is Serviceable Obtainable Market or SAM?

The SAM refers to the portion of the total addressable market (TAM) that a company or business can realistically target and serve. It represents the market segment that aligns with the company’s resources, capabilities, and competitive positioning. The SAM is determined by considering factors such as geographical scope, customer demographics, and market demand.

In the context of top-down market sizing, the SAM is the result of narrowing down the initial macro view of the market to a segment that the company can effectively target. It represents the potential customers and revenue that the company can realistically obtain within its market segment. The SAM is an essential metric in market research as it helps businesses understand the true size and growth potential of their target market.

What is Total Addressable Market or TAM?

The Total Addressable Market (TAM) represents the entire demand for a specific product or service within a particular market or industry. It is the maximum potential revenue that can be achieved if a company were to capture 100% market share, considering all potential customers and their willingness to purchase.

TAM provides an estimation of the market size and serves as a starting point for market analysis and business planning. It encompasses all potential buyers who have a need for the product or service, regardless of whether they are currently being served by existing competitors or are aware of the product’s existence.

Calculating TAM involves considering various factors such as market demographics, geographic scope, industry trends, and customer behavior. TAM helps businesses understand the market’s overall revenue potential and serves as a benchmark against which to evaluate their market share and growth opportunities.

It’s important to note that TAM represents the theoretical market size and may not be fully reachable or realistic for a company due to constraints such as competition, resources, and market saturation. Nevertheless, TAM serves as a valuable reference point for strategic decision-making, market segmentation, and assessing a company’s growth potential within a specific market.

How to use top-down market sizing

To use top-down market sizing accurately, you should aim to start with a macro view of your market and work towards a micro view.

The first step is to look at industry size estimates to find the largest possible market size for your product. Then, reduce it to a segment that you can realistically target, and then calculate how many potential customers are in that segment.

For example, if you’re selling a payment management system for hair salons in the US, you’d start by calculating the total number of hair salons in the US. Then, reduce that to a smaller segment — how many of those salons have enough customers to justify a payment system? Finally, find out which ones you have already sold to, or which ones are already serviced by competitors and unlikely to buy from you, and so on, to find your serviceable obtainable market.

Here are some tips to do this process as effectively as possible:

  • Use reliable data sources. Some of the data that can help you calculate your market size is available for free or at low cost and can be obtained from analysts like Gartner and the Bureau of Labor Statistics. This can be supported by primary research to give you a rich picture of the market. Spend some time analyzing multiple, reliable sources to come up with an  estimate..
  • Be consistent and clear in your approach. Make sure your calculations are well-documented and rely on the same data.
  • Ask lots of questions throughout the process. Who are our customers? Where are they located? Is the market growing? Aim to get as full and accurate a picture of your market as possible.
Stay ahead

Get regular insights

Keep up to date with the latest insights from our research as well as all our company news in our free monthly newsletter.

What factors to consider when using market sizing

When deciding which approach to use for market sizing, it’s essential to consider various factors that align with your business, product, and market dynamics. Here are some considerations to help you choose the most suitable approach:

  1. Market maturity: If you are entering an established and well-researched market with ample data available, a top-down approach might be more appropriate. The existing market data can provide a solid foundation for estimating market size and potential customers.
  2. Product uniqueness and disruption: If your product or service is innovative, disruptive, or targets a niche market, a bottom-up approach can be advantageous. This approach allows you to analyze specific customer segments, understand their unique needs, and project adoption rates more accurately.
  3. Available data and resources: Consider the availability and reliability of data sources. Top-down market sizing heavily relies on existing market research and industry reports. If comprehensive data is readily available, a top-down approach can provide a quick estimate. On the other hand, if you have access to internal data, customer insights, or primary research capabilities, a bottom-up approach using your own data can yield more accurate results.
  4. Granularity and specificity: Depending on your business objectives, you may need a more detailed understanding of your target market. In such cases, a bottom-up approach allows for a more granular analysis, enabling you to assess market segments, customer behaviors, and potential adoption rates on a more specific level.
  5. Time and resource constraints: Consider the time and resources you have available for market sizing. Top-down approaches are generally faster, as they rely on existing data and industry research. Bottom-up approaches require more in-depth analysis and data collection, which may be time-consuming. Evaluate the trade-offs between accuracy and the resources you can allocate to the market sizing process.

Ultimately, the choice between top-down and bottom-up approaches depends on your business context, market characteristics, and the level of precision required for decision-making. In some cases, using a combination of both approaches can provide a more comprehensive view of the market size and potential opportunities.

Remember, market sizing is an iterative process, and as your business evolves and gathers more data, you can refine and update your estimates using the most suitable approach for each stage of growth.

The top-down and bottom-up approaches — which one is best?

So, which approach is better? The reality is that each method has its pros and cons. What works extremely well for one business might not work well for yours, and vice versa. Let’s take a look at the advantages and drawbacks of each method.

Top-down market sizing: the pros

  • It tends to be faster than a bottom-up approach..  The process of gathering existing data to estimate your market size isn’t enormously time-consuming, making it .  the best option to get a quick estimate of the serviceable obtainable market, which you can supplement with primary data at a later date to reach a more accurate forecast. .
  • It tends to work well for big, established markets, where there is already plenty of data and existing analysis

Top-down market sizing: the cons

  • It doesn’t work as well for new, smaller markets and disruptive products. If there’s a good chance your product could have a disruptive effect on its market, this could significantly affect serviceable obtainable market and render your top-down analysis largely meaningless.
  • The initial research relies on general information collected by others, so the data isn’t specific to your business and situation. It’s a good general guide, but does need to be supported by primary research that’s specific to your particular market for greater accuracy. 

Bottom-up market sizing: the pros

  • It’s tailored to your specific circumstances and uses your own data 
  • It’s especially useful for new markets and markets where your product is likely to make a big, disruptive impact
  • It tends to result in better forecasting and more accurate data on amore granular level, helping you better understand how your individual projects will make an impact

Bottom-up market sizing: the cons

  • It can take longer and require more resources than a top-down approach, as a bottom-down approach requires much more in-depth analysis of your own business.
  • It has a tendency to assume there will be more customers than there actually will. This is important to look out for.
  • Any errors you make early on at the micro-level become compounded as you work up to the macro-level. It’s important to ensure you’re doing everything the right way, or these mistakes and misunderstandings will carry through your entire analysis.

Examples of Top-down and Bottom-up Market Sizing

To provide a clearer understanding of top-down and bottom-up market sizing, let’s explore some real-world scenarios:

  1. Top-down market sizing example: Imagine you are launching a new line of organic skincare products. To calculate your serviceable obtainable market (SAM) using a top-down approach, you would start with a macro view of the market and narrow it down. Here’s a step-by-step breakdown:
  • Step 1: Begin with industry size estimates: Research industry reports and studies to determine the total skin care market size.
  • Step 2: Identify your target segment: Narrow down the market to a specific segment that aligns with your organic skincare products, such as “organic skincare for sensitive skin.”
  • Step 3: Calculate potential customers: Determine the number of potential customers within your target segment. For instance, you might find that there are 5 million people in your target market based on demographics and consumer behavior analysis.
  • Step 4: Refine the SAM further: Consider factors like geographical location, purchasing power, and competition to determine the portion of the target market that you can realistically capture.

By following this top-down approach, you can estimate the SAM for your organic skincare products and make informed decisions about market entry and potential revenue.

  1. Bottom-up market sizing example: Let’s say you’re a software startup developing a productivity app for freelancers. To perform bottom-up market sizing, you would start with your own product and gradually build up:
  • Step 1: Identify your target audience: Determine the specific segment of freelancers you are targeting, such as graphic designers or copywriters.
  • Step 2: Determine the basic units: Calculate the number of potential customers within your target segment, considering factors like industry reports, freelance platforms, and online communities.
  • Step 3: Assess market penetration: Estimate what percentage of the target market you can realistically capture based on your value proposition, pricing, and competition.
  • Step 4: Calculate revenue potential: Multiply the estimated number of customers by the average revenue per customer to determine your potential revenue within the target market.

By employing a bottom-up approach, you can analyze the granular details of your specific market segment and tailor your strategy accordingly. This approach allows you to make projections based on your own data and assumptions.

These examples showcase how top-down and bottom-up market sizing approaches can be applied in different scenarios. Remember, the choice of approach depends on factors such as market maturity, product uniqueness, available data, and the goals of your business.

Ultimately, it can be useful to use both models in your market sizing. If they both roughly agree, then you can probably assume you have a fairly accurate estimate of your market size. The approach you opt for will also depend to some extent on the type of business you’re building and the product you’re selling.

Regardless of which approach you go with, it’s important to do it right. At Kadence, we have many years of experience helping businesses with their market research, and in sizing the market and we can help you do the same. To find out more, get in touch.