


Trusted by
Trusted by
Trusted by
Survey design is an important part of doing business and market research. Put simply; it refers to the process of creating surveys that get responses.
This is important because it allows you to better understand the market and your customers, so you can make more data-driven decisions and fix areas that are falling short. Done right, a good survey can be the driving force for huge positive change.
How to design a survey
Planning
The first stage of survey design is all about planning. This is where you’ll decide what you want to focus on, why you’re running a survey at all, who you want to target, and more.
If you don’t get this stage right, you’ll end up with a survey that doesn’t have any clear goals or fails to achieve its objectives. To get meaningful feedback from a survey, you must be clear about what you’re trying to achieve.
This initial stage is extremely important and is not something to skim over or rush through. In fact, the planning stage should take up a large chunk of the overall process.
1. Figure out your goals
The goal of the survey is what gives it structure and influence every part of the process. Here are some examples of goals for surveys:
- Find out what customers think about your brand versus the competition
- Assess the main challenges faced by customers in your industry
- Learn what customers like the most and least about a specific product.
Goals should typically be narrow enough that there is no risk of confusing your stakeholders or your respondents. Narrow goals also avoid overwhelming your respondents with questions.
A clearly defined goal helps the team draw inspiration and stay united and focused. Once you have decided on a goal, you’ll have a much better idea of what type of questions to ask, the type of respondents you want to reach, and so on.
In other words, you need to set a goal in order for the rest of the process to click into place.
2. Decide who you want to target with your survey
The next stage of the planning process involves deciding who will actually take part in your survey.
This is called the target population, and it should reflect the goal. For example, if you’re asking how your product impacts a person’s job, it’s probably not a good idea to target people under 16 or people over 70 as they are unlikely to be working.
3. Choose the right sample
The target population you choose will often be too large to effectively survey. This means you’ll have to select a sample — a smaller group that represents the larger demographic. You can then take these results and extrapolate them to the wider population.
Done right, this group will be representative enough to act as a miniature version of the whole. Sampling allows you to achieve your goals with a fraction of the cost, time, and resources required to survey the entire target population, which in most cases, would simply not be possible.
4. Pick the right survey method
This stage of the planning process will be driven by your goal and your target demographic. Some examples of different methods include:
- Online Internet surveys
- CATI (computer-aided telephone interviewing)
- Central location testing
Every method has its pros and cons. Online surveys enable you to reach a large number of people quickly, but they’re less appropriate if you’ve got a physical product you want people to interact with. Instead, a central location test might be more appropriate in this instance.
Every survey is different. If your target population is mostly people over the age of 65 or in geographical locations where internet access is not widespread, online surveys will probably not be the best method. Likewise, a central location test might not work well if your target demographic is very busy.
Once you have decided on a goal, established a target population and a sample, and chosen the method for your survey, it’s time to get down to actually creating it.
Stay ahead
Get regular insights
Keep up to date with the latest insights from our research as well as all our company news in our free monthly newsletter.
Creating your survey
Creating your survey is all about making it as easy as possible for your respondents to read, understand, and answer. If you overwhelm them with information and confusing formats, they’ll quickly give up and you’ll end up with fewer answers and a smaller pool of data at the end.
Here are some ways to make your survey as effective as possible:
How to write effective survey questions
Writing good survey questions is essential to gather accurate and meaningful data. You need to ask enough to gather a good amount of information, but if you use too many, you risk driving your respondents away.
It’s always best to start with a clear introduction that introduces the survey, explains the format, and addresses any initial questions the reader might have. You might then start with some screener questions (about age or job title, for example) to filter out any respondents who don’t match the target demographic.
Here are some guidelines to help you write effective survey questions:
- Define your objectives: Identify the purpose of your survey and the specific information you want to gather. This will help you frame your questions appropriately.
- Keep it concise: Make your questions clear, concise, and concise. Avoid using complex or technical language that may confuse respondents. Use straightforward language.
- Avoid leading questions: Avoid questions that suggest a particular answer or influence respondents’ opinions. Use neutral language and focus on gathering unbiased responses.
- Use closed-ended and open-ended questions: Closed-ended questions offer respondents predefined answer choices (e.g., multiple-choice, Likert scale), making it easier to analyze the data quantitatively. Open-ended questions allow respondents to provide detailed and personal responses, offering qualitative insights.
- Use a mix of question types: A variety of question types can keep the survey engaging and provide different perspectives on the topic. Mix multiple-choice, rating scales, ranking, and open-ended questions to gather diverse data.
- Avoid double-barreled questions: Double-barreled questions simultaneously ask about two different things, confusing respondents and leading to inaccurate responses. Instead, ask separate questions to address each aspect.
- Order questions logically: Arrange your questions in a logical flow that makes sense to respondents. Start with easy, non-sensitive questions to build rapport and then move to more complex or personal questions.
- Pilot test your survey: Before launching your survey, conduct a pilot test with a small group of respondents to check for clarity, relevance, and potential issues. Make necessary revisions based on their feedback.
- Offer response options that cover all possibilities: Ensure that the response options for closed-ended questions cover all possible answers. Include an “Other” or “Not applicable” option if necessary.
- Avoid jargon and technical terms: Use language familiar to your target audience. Avoid industry-specific jargon or technical terms that may confuse respondents.
- Use scales consistently: If you use rating scales or Likert scales, ensure that the response options and scale labels are consistent throughout the survey. Clearly define the meaning of each point on the scale.
- Consider the order bias: The order of questions can influence responses. Be mindful of this bias and consider randomizing the order of answer options or questions to minimize its impact.
- Test for survey length: Long surveys can lead to respondent fatigue and higher dropout rates. Keep your survey as concise as possible while still capturing the necessary data.
- Offer anonymity and confidentiality: Assure respondents that their responses will remain anonymous and confidential. This encourages honest and accurate answers, especially for sensitive topics.
- Review and revise: Proofread your survey questions for clarity, grammar, and spelling errors. Take the time to review and revise the questions to ensure they accurately reflect your objectives.
Following these guidelines, you can create well-crafted survey questions that generate reliable and meaningful data for your research or analysis.
Executing the survey
Once the survey is planned and created, it’s time to implement it. If you have done the earlier stages correctly, this part should run smoothly. However, in practice, errors and unexpected setbacks are common. Here’s how to execute your survey in the best way possible:
Work with trained researchers
If your survey will be carried out in person or on the telephone, it’s important that your staff know how to write survey questions. Ensure you’re working with a team trained to ask open-ended questions correctly in a way that avoids confusion or tempts bias.
Pilot surveys
A common practice is to conduct a smaller pilot survey before the main one, which can help identify any problems with the survey and give you an opportunity to make some tweaks before sending it to the full sample group.
Avoiding bias
One of the main challenges when conducting surveys is bias. It’s easy to accidentally lead your respondents down a certain path and encourage them to answer in a certain way, which you must avoid in order to get accurate and valuable results. To minimize bias:
- Avoid leading questions like comparisons with other companies or products
- Keep questions as precise and simple as possible to eliminate the risk of misunderstanding
- Try to predict inherent biases in your target group and work to mitigate them
Analyzing and sharing results
After the survey is complete, the final steps are to analyze and share the results. This is an extremely important step, as this is where you put into practice what you learned and draw value from the survey.
It’s important to categorize and analyze the results properly. This process might be as simple as collecting the results in an Excel spreadsheet, or it might be much more detailed, using a range of advanced analysis techniques..
Think about how the survey relates to your overall business and marketing and how you can act on the insights you gained and use them to achieve your goals.
Create a summary report
A summary survey report is a great way to share your results with your stakeholders in the business. It’s a document that breaks down what your survey set out to achieve and the key findings. We regularly create summary reports, as well as longer, more detailed reports for our clients.
Make sure to clearly show what your aims were and what you learned, and present this in a way that anyone – regardless of market research literacy – can get to grips with. It’s worth working with a good designer to present the findings in the best way possible. At Kadence, we have our own design team who help us to create impactful reports that make data easy to understand and act upon.
Survey design can seem like a challenging process, and it does require input and collaboration from many parts of the company.
However, the rewards are worth it. A well-designed survey can provide a much more intimate understanding of your customer base and how your products and services are received. It can yield incredibly valuable feedback and prompt much-needed change.
To find out how Kadence can help your organization plan more effective surveys and harness data for maximum effect, reach out to request a proposal.
Conjoint analysis is often lauded as an extremely effective way to gain detailed insights and conduct market research, but how does it work?
Essentially, conjoint analysis is a method of measuring the value that customers place on different features of an existing or new product. It typically works via a survey, which looks something like this:
Participants are shown a combination of features (called attributes) for a product. If the product is a smartphone, for example, they might be shown the price, memory size, screen resolution, and camera quality. They’re then asked to compare different attributes. For example, what would they choose between a $150 phone and a $250 phone? Do they prefer 32GB of memory or 64GB? There are several ways to structure this, as we’ll find out. After the answers have been collected, we analyze the results to inform the right marketing decisions.
Conjoint analysis is a powerful market research method used to analyze and understand customer preferences. It is particularly valuable in assessing product attributes and their impact on consumer decision-making. In this blog post, we’ll delve deeper into the different types of conjoint analysis and the various benefits it can deliver.
Why Do Conjoint Analysis?
By examining various factors such as product features, price, brand, and packaging, conjoint analysis provides insights into how different attributes influence the target audience’s choices. This market research method proves especially beneficial in different stages of the product life cycle, from initial business analysis and product design to the product launch and beyond.
Conjoint analysis aids great product managers, designers, and project managers in making informed decisions by identifying the optimal combination of features and attributes that resonate with the target audience. It leverages research techniques like mail surveys, personal interviews, focus groups, and telephone surveys conducted by skilled survey researchers to gather data on consumer preferences and opinions. This valuable information helps development teams refine and optimize the final product, ensuring it meets customer needs and expectations.
Additionally, conjoint analysis provides insights into the competitiveness of existing products and aids in strategic planning for future product enhancements or new offerings.
Reasons to Conduct Conjoint Analysis
There are several reasons to conduct a conjoint analysis, including:
- To measure and understand customer preferences for certain product features.
- To assess or predict how well a new product will do if brought to market.
- To gain an understanding of how changes in price affect demand.
- To predict future trends, for example, around the adoption of certain features.
How to Conduct Conjoint Analysis
Choose the Right Survey Type
The first stage is to decide on the correct survey type. There are several ways to do a conjoint analysis — here are the main methods:
- Ratings-based conjoint analysis: This is where participants give each attribute a rating, for example, on a scale of 1-100.
- Ranking-based conjoint analysis: This is where participants rank the attributes in order from best to worst. There is also a best vs. worst analysis, where participants simply pick their favorite and least favorite attributes from the selection.
- Choice-based conjoint analysis (CBC): This is the most commonly used model and the one this guide will focus on. It presents combinations of attributes to participants and asks them to choose which they prefer.
One of the most powerful advantages of choice-based conjoint analysis is that it can allow you to use modeling to predict how customers will feel about combinations they didn’t even assess. In other words, it is an extremely efficient way of predicting responses to features without having to spend a huge amount of time testing each combination.
Identify the Relevant Attributes (Features)
Next, it’s time to decide which product attributes you want to have your respondents compare and assess. The key is not to use too many. We typically avoid using more than 5 or 6 attributes, e.g., for a car: color, engine size. We do this to reduce respondents’ cognitive load to ensure they engage with the choices presented to them.
For each attribute, you need to add levels. For example, if your participants are assessing a smartphone, one attribute might be ‘price,’ and the levels might be $200, $350, and $700.
The levels will usually reflect the different tiers of the product you’re considering selling. For the smartphone, you might be releasing a basic model, a higher-end model, and a deluxe model. The levels for attributes such as price, camera size, and memory will align with those tiers.
Levels should be chosen based on factors like:
- How interesting and valuable they are for management — will they inform useful decisions?
- How well they avoid bias?
- How realistic they are.
In the CBC method, there are two commonly used models for making choices:
- Single choice with none: This requires the participant to make one choice out of the selection. There is also the possibility to select none of the options.
- Single choice: This is the same as above, but there is no ‘none’ option — the participant has to pick one.
Design the Questionnaire
Screener Questions
Most surveys start with some screener questions. These are general questions around demographics like the respondent’s age, job title, or purchase habits. The goal is to filter out those who won’t be a good fit for the survey based on the people you’re trying to target.
Introduce and Explain
It’s important to take some time at the beginning of the survey and in your questions to clearly explain what the respondents need to do to answer the questions. Surveys should be as clear and easy to follow as possible.
Create the Right Questions
The questions you choose and how you structure them will make or break your survey. Here are some guidelines to follow:
- Questions should follow one another logically and be grouped together intuitively. It’s best not to confuse your participants by ordering your questions in a confusing way.
- People often give more accurate and useful answers when you use situational questions. For example, instead of asking, “Which phone would you buy?” ask something like, “Thinking back to the last time you purchased a phone — if you had the following options instead, which would you have picked?”
- Finish with some demographic questions so that you can further understand your customer base and analyze the results by demographic to understand any meaningful differences.
Analyze and Take Action
Once the survey has been written, scripted, sent out, and completed by your target group, it’s time to analyze the results and take action on them. This is perhaps the most important part of the process, as it’s where your research can really make a tangible impact.
There are several ways to analyze your results based on how you designed the survey. The most important thing is to collect and analyze your data in a way that makes it easy to draw useful conclusions and share them.
This will allow you to gain real value from the survey and present those findings to others in the company. This:
- Helps justify your decisions and actions.
- Informs future plans and inspires new features.
- Identifies areas that need to change or improve.
At Kadence, it’s our job to ensure you create and conduct the most effective surveys and market research possible, giving your brand the edge. To find out more about how we can help with conjoint analysis and more, get in touch to request a proposal.
Conclusion
Conjoint analysis is a valuable tool in understanding consumer preferences and making informed product development decisions. By carefully designing and executing your surveys, you can gain insights that drive strategic planning and optimize your products to meet market demands. Whether you’re evaluating new product features, pricing strategies, or competitive positioning, conjoint analysis can provide the detailed insights needed to succeed in today’s competitive market landscape.
Stay ahead
Get regular insights
Keep up to date with the latest insights from our research as well as all our company news in our free monthly newsletter.
As a result of the COVID-19 lockdowns, education institutions across the globe have faced a myriad of challenges, including the move to distance learning and finding new ways to support pupils. Students have also had to adapt with the support of an in-person learning environment
Now that some educational institutions are emerging from the pandemic, it will be important not just to address short term needs but also to identify innovations that can be adopted to improve student learning in the long run.
This piece explores three key challenges to address in the short term but also considers the long-term implications of what these new changes may bring. The 3 themes we’ll be looking at are:
- The role of a “classroom” and going beyond physical spaces
- Rethinking the way we share knowledge
- Addressing current inequalities and what educators can do to ensure the future success of students
Where is the classroom?
Short-term trends
As governments and educational institutions make decisions on when and how to reopen schools, health and safety is naturally front of mind. Some schools have opened with strict checking procedures in place. In Shanghai, for instance, students are required to enter the school building via a thermal scanner and there are multiple posters in place highlighting the measures in place to tackle coronavirus. In other schools, remote learning is still continuing as only limited numbers of pupils return. Schools in New South Wales, Australia, for example, have re-opened but are only allowing students to attend one day a week on a staggered basis. Whatever the approach, the priority continues to be safeguarding people’s wellbeing and schools will observe and learn from countries that are practicing safe re-opening procedures.
Long-term trends
However, the COVID crisis has also demonstrated that classrooms are not the only places where education can take place. The pandemic has highlighted that learning can take place at any time, anywhere and in any way. It’s clear that the opportunities offered by digital capabilities will go well beyond its temporarily use during the crisis.
Technology can enable teachers and students to access massive amounts of digital resources, most of which are free to use. Examples from other countries have also shown that the delivery of information through various means – TV, online, mobile – can work to help engage students. What’s more, AI and digital technology are now able to capture data to measure students’ progress so that learning can be adjusted based on ongoing assessments rather than through high stakes exams.
Stay ahead
Get regular insights
Keep up to date with the latest insights from our research as well as all our company news in our free monthly newsletter.
Rethinking Knowledge Sharing
Short-term trends
Just as students are adjusting to distance learning, most teachers are also new to teaching online and have had to quickly adapt their lessons to an online format that keeps pupils engaged.
But teachers don’t just need the technological tools to facilitate online learning. They need resources to help enhance their teaching practice. A number of initiatives have sprung up around the world to facilitate this. In South Korea, the Education and Research Information Service offers an online platform to facilitate the sharing of materials created by teachers and in the United Arab Emirates, the Ministry of Education invited over 40,000 teachers to take part in a ‘Be an online tutor in 24 hours’ course. Global organizations such as the Khan Academy, TEDed, Google Arts & Culture are also continually providing relevant education resources for students and teachers.
Long-term trends
In the long-term, we may see a new form of teaching emerging. In a world where students can access to knowledge through a few clicks, educators will need to review and potentially redefine their role in the classroom.
The emphasis should be not only on the delivery of content but also on generating engagement. Educators need to learn to create a positive experience within a digital context – one that is more interactive and engaging. One organisation leading the way on this is Singapore’s SIT University, which has created training materials for lecturers to provide online learning. The topics covered how to create narrated slides, how to run effective live streaming classes, how to design alternative assessments, and the use of online proctoring tools for assessments.
Addressing current inequalities and what educators can do to ensure the future success of students
Short-term trends
While technology has helped many students continue their education at home, data from UNESCO has found that in other ways, it has exacerbated the digital divide. Half of all students do not have access to a computer and more than 40% have no internet access at home.
Students living in rural areas, low-income households, students with special needs and those living in less developed areas face issues with a lack of resources including not having the technology needed for remote learning.
Governments, private companies, and educational institutions need to be able to work in partnership to ensure that needs of all students are met. Success stories from around the world can provide inspiration. In France, the University of Strasbourg identified students whose lack of resources jeopardized their ability to continue their education, setting up an Emergency Fund and distributing more than a hundred computers to students in need. China offered mobile data packages, telecom subsidies and repurposed some of the state-run television channel to air lesson plans for K–12 education in remote regions. Italy put together an €85 million Euro package to support distance learning for 8.5 million students and improve connectivity in isolated areas.
Long-term trends
While COVID-19 has fast-tracked the need to acquire digital skills, we also cannot forget the education students will need to prepare them for the workplace of the future.
As a result of the pandemic, the demand for certain jobs and specialties will decline, whilst other areas come to the fore. Educational institutions need to be flexible enough to adapt their curriculum and resources to meet students’ and workforces’ changing needs.
There will continue to be a need to train people in emerging digital skills but learners will also need “non-automatable” skills. According to the World Economic Forum’s Future of Jobs Survey, “a wide range of occupations will require a higher degree of cognitive abilities — such as creativity, logical reasoning and problem sensitivity — as part of their core skill set.” Institutions who more readily recognize and adapt their curriculum and resources to meet these needs are more likely to thrive moving forwards.
You might also be interested in


The automotive industry has been one of the hardest hit by the pandemic. Cars have lain dormant in driveways for months as a result of lockdowns across the world, and economic shutdowns hit supply chains, with reports of some manufacturers even resorting to flying parts across the world in suitcases.
But as consumers emerge into a ‘new normal’, what does this mean for the automotive industry? What are the trends to watch – both in the short and the long-term?
In this article, our auto experts across the UK, Thailand and Indonesia, Bianca Abulafia, Digo Alanda and Kajornkiat Kiatsunthorn explore 3 key areas:
- Changing purchase patterns
- The future of electric
- The digital path to purchase
Changing purchase patterns
Short term
In the short-term, we expect to see growth in the second hand and luxury end of the market especially.
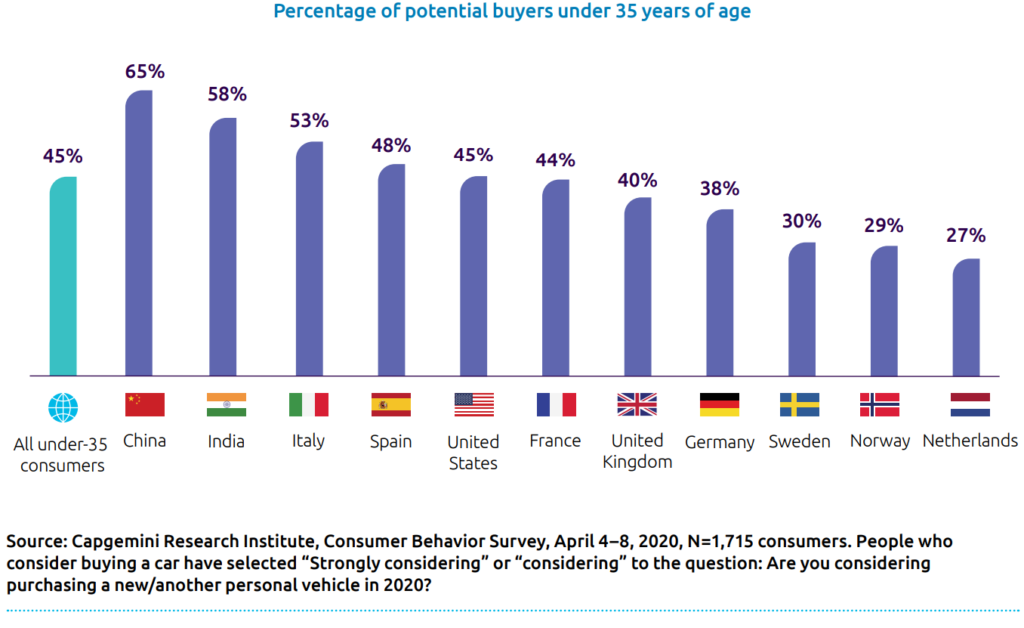
The pandemic has resulted in a renewed focus on the car as hygiene concerns have come to the fore. This has resulted in those that have previously shunned car ownership such as urbanites and young people re-evaluating their stance. In the US, a cars.com study showed that 20% of people who don’t own a car are thinking of buying one, and this figure rises when we hone in on young people. A recent global Capgemini survey of under 35s shows that 45% are considering buying a car and this is highest in countries that have been hardest hit by the pandemic.
We have talked about the emergence of “revenge buying” in other sectors, and we expect this to manifest in the automotive industry within the second-hand market as a more affordable option for younger buyers. “Revenge buying” is also relevant at the luxury end of the market. As a result of being able to save, the budget of some affluent buyers has increased, meaning that they’re now able to trade up. Volvo’s Chief Executive notes this has happened in China, where the company has seen a 20% increase in sales compared to 2019. “People are really tired of sitting at home locked and they really want to go out and buy.” Outside of this, we expect sales to suffer, with existing car owners putting off purchases in the midst of economic instability.
Long-term
Looking at the long-term impact, it will take some time until car sales return to pre-COVID levels. An ING report, looks back to the 2008 financial crisis for indicators, highlighting that it took 11 months for vehicle sales to recover in this instance. But if we consider that this pandemic has brought lifestyle and behavioral changes, in addition to economic instability, it’s much harder to predict.
In the long-term, will we see a permanent shift towards home working that encourages people to move out of urban centers, necessitating the need for a car? Will increased domestic tourism result in a desire to have access to a car for longer trips – ushering in an opportunity for shared ownership of vehicles? The automotive industry doesn’t exist in a vacuum and it will be vital for auto manufacturers to observe the broad trends to understand where they can play a role.
Stay ahead
Get regular insights
Keep up to date with the latest insights from our research as well as all our company news in our free monthly newsletter.
The digital path to purchase
Short-term
Car manufacturers have had to rapidly adapt to a new sales environment, as they seek to comply with social distancing measures and meet the needs of the more cautious shopper. Capgemini’s COVID-19 and The Automotive Consumer report indicates that 46% of consumers want to minimize visits to dealerships to compare offers, instead preferring to do this online. We’ve seen lots of innovative responses to this. In China, for instance, Volkswagen has trained 70,000 employees to communicate with customers online, even livestreaming from dealerships via TikTok and Kuaishou.
Long-term
In the long-term, we only expect this to continue. The impact of coronavirus has acted as a catalyst for the digital transformation of many industries, sparking changes in consumer behavior that were thought to take years. Automotive will be no exception as people seek the convenience that they’re experiencing in their interactions with other brands and industries. This will be particularly important in the research phase but we believe it will also extend to online purchase and home delivery, with a recent Think with Google survey finding that 18% of people would buy a vehicle sooner if there was an online purchase option. The desire for convenience could also impact the after sales experience with servicing being carried out at home.
The future of electric
Short-term
In the immediate term, economic instability, plus the appeal of lower oil prices, could dissuade car buyers from making the move to electric. However, we don’t expect this to last long, with any savings from oil prices likely to be temporary, and not significant enough in the long-term to fundamentally influence decisions.
One area to watch is other electric transportation options beyond the car – such as scooters and bikes. As people avoid public transport and seek other routes around the city, governments are having to radically rethink how they can support this. The UK has announced that improvements in cycling infrastructure and trials to allow rented e-scooters on the streets have been fast-tracked, which could encourage people to start exploring electric bikes and scooters as alternative options for commuting. Increased familiarity with electric powered means of transportation could result in a greater adoption of motorbikes or cars.
Long-term
When we look at the long-term view, we don’t expect the shift towards electric to be significantly impacted. From the canals in Venice being clear enough to see the fish to Nasa satellite images showing the dramatic drop into pollution levels in China, the upsides of the lockdown on the environment have been well documented – with many consumers acknowledging benefits of this on their quality of life.
This could influence purchase behaviors in the longer term, with consumers wanting to do their bit for the environment at the point at which economic conditions become more favorable for them to do so. But more significantly, changing consumer sentiment towards the environment is also likely to increase pressure on governments to bolster schemes to incentivize electric car ownership, making them a more financially attractive proposition to car buyers. In fact, this is something that has already happened in China in the wake of the pandemic, with some cities announcing subsidies for new electric vehicles, and others upping their investment in the associated infrastructure.
We also shouldn’t forget the status symbol factor, particularly in the luxury segment. Our research has shown that owning an electric car represents a new way to demonstrate wealth and status, and we don’t see this diminishing any time soon.
You might also be interested in
When we look the impact of COVID-19 on the media industry it’s a mixed picture. Whilst some areas, like video streaming services, have thrived as a result of increased time at home, others have come to a complete standstill, such as OOH advertising and cinema. But which trends in media will persist?
In this article we explore 3 key areas of the media landscape:
- Linear TV
- Streaming services
- Advertising
The role of linear TV
Short-term changes
As people have been forced to spend time at home and routines have been upended, viewing of linear television has enjoyed a resurgence. According to the BBC, viewers were watching 44% more linear channels in May compared to this time last year, rising to 67% for young people. A trend that flies in the face of pre-pandemic viewing behavior.
The rise of linear television in this period should really come as no surprise. It’s allowing for shared moments at a time when human connection is in short supply. Thinkbox observed a 30% increase in shared viewing in this period.
Content preferences have also shifted, reflecting the pandemic situation, with programs that allow for nostalgia and escapism proving popular with viewers.
Long-term trends
We expect the rise of linear TV to be short-lived. As a direct response to the lockdown, it’s unlikely that this behavior will persist as the pandemic subsides. As economies reopen, and consumers given more freedom to socialize, we expect to see linear TV consumption patterns return to pre-pandemic levels, as the long-term trends we’ve seen towards VOD and SVOD continuing.
Stay ahead
Get regular insights
Keep up to date with the latest insights from our research as well as all our company news in our free monthly newsletter.
Streaming
Short-term changes
Streaming providers have been one of few beneficiaries of the COVID-19 crisis. With more time on their hands at home, people are turning to paid online streaming services – and some for the very first time. A survey for the Consumer Technology Association carried out in March found that 26% of US consumers are using video streaming services for the first time. A combination of new users like these, and others that have added to their existing subscriptions are creating big returns for streaming giants. In the first quarter, Netflix more than doubled the number of new subscribers it had expected. Disney Plus is another success story. Just 8 months after launch, it has over 54 million subscribers globally. This puts it in touching distance of its 2024 target, a whole 4 years early.
Medium and long term
In the long-term, it’s difficult to predict exactly how streaming will fare. One school of thought is that as the economic impact of the crisis hits consumers will re-evaluate their discretionary spending, and cut back, which could see subscriber numbers fall, particularly amongst those with multiple subscriptions.
Others argue that as consumers tighten the purse strings, they’ll be scaling back on more significant purchases. This could mean that spend on streaming services will be protected as a worthwhile investment, particularly if the focus on the home remains, with working from home continuing in the long term.
One trend that we expect to remain is the emphasis on shared viewing on demand. We’ve seen streaming providers innovating to meet this need with features like Netflix Party, that allow users in different locations to synchronize playback and communicate via a group chat. Meeting the desire for shared experiences but enabling different audiences in one household to watch what they like, we see this trend being important in future.
Another development to watch out in the medium-term is the future of film. During the pandemic Universal Pictures made some of its film releases available on demand on Comcast, Sky, Apple and Amazon for a one-off fee. With the emphasis on value for money and continued social distancing, will this be an attractive option to consumers in the medium, and a way to offset lost revenues from cinemas?
Advertising
Short term
The drop in advertising spending during the pandemic has been well documented. According to a report from Publicis, Q1 ad spend was down 15% in China and 9% across Europe, as companies sought to cut costs and postpone campaigns. And with this continuing in Q2 and into the second half of the year, the World Federation of Advertisers predicting a 31% decrease in investments across 2020.
In response to the pandemic the tone of ads has changed too, with many brands emphasizing their contribution to the relief effort or how they’re supporting customers in this difficult time. In the short-term, we can’t expect an immediate return to pre-pandemic marketing strategies. Our recent research Brands Exposed research, with 4,000 consumers across 10 countries found that levels of worry around the pandemic influence how consumers respond to ads, with overt sales messaging being rejected by those that are most worried, in favor of more reassuring advertising. This indicates that in the short-term, brands will need to make a concerted effort to understand the sentiment of their customer base and position their ads accordingly.
Medium to long-term
Advertising has always had to shift in response to behavioral changes, and this will be no exception. A recent Goldman Sachs report predicts that “the crisis will only accelerate the secular shift in advertising budgets towards digital.”
In the medium and long-term, we expect to see brands funneling more money into digital advertising, reflecting the increase in time that consumers are spending on digital channels. Social media usage is up 21% globally. It’s likely that advertisers will also look to move ad spend towards ad supported streaming services, at the expense of TV.
In the long-run, we also expect to brands continuing to place a sustained importance on responsibility and honesty, in response to rising consumer expectations, as suggested by our Brands Exposed research.
You might also be interested in
Over the past few months, COVID-19 has had a significant impact on how we think and behave when it comes to food and beverage (F&B). When lockdowns were implemented in countries around the world, non-essential retailers were closed, dining-in was prohibited, and supply chains were tested. As a result, buying behaviors and attitudes have changed and F&B retailers are having to respond rapidly. Those that are able to act quickly will be able to emerge triumphant past the crisis, with many new strategies remaining relevant even after the pandemic.
As countries are opening up, a common question among businesses is ‘what next?’ Governments around the world are trialing different measures to reopen the market, while trying to minimize the likelihood of a second wave of mass infections. Businesses are on one hand rapidly trying to adapt to the latest governmental policies, and on the other, thinking about how they should change to cater to a marketplace that in some ways looks very different. We’ll explore 3 key trends, with our thoughts on what is likely to stay post-COVID when it comes to F&B:
- Consumer behavioral changes
- Business adaptability
- Unfulfilled consumer needs
‘Stay home projects’: behavioral and purchasing patterns arising out of having to eat at home
Short term changes
While purchases of luxury products have largely decreased during the pandemic, there was a sharp rise in everyday products. With the closure of physical stores, and restaurants doing takeaway only, more people embarked on different ‘stay home projects’, experimenting with homemade recipes.
According to social listening data from Circus Social, people in Singapore, Japan, South Korea and Indonesia ended up making more homemade snacks during this period. In China, the sale of egg whisks on online retailer Tmall increased five-fold year on year. In Singapore, essential baking ingredients such as yeast and baking soda were wiped off the shelves in most supermarkets during the first month of the Circuit Breaker, and many consumers looking for alternatives online. This shift has had a huge impact on supermarkets and grocery retailers, forcing them to look for alternative sources of supply and diversifying their supply chain strategy.
The surge in interest in ‘stay home projects’ has also led to a dramatic increase in the viewership of inspiration channels as well as recipe searches, with Instagram-worthy home café recipes trending on social media shortly after they were posted. This presented opportunities for brands to think about showcasing their products through strategic product placements on these channels. This may not be a novel strategy, but it has become highly relevant given the larger share of eyeballs on these channels during this period. In addition, we see F&B brands offering home cooking meal kits, riding on the wave of ‘stay home projects’ and engaging with partners to showcase the ease of using these meal kits online.
Long term trends
We believe that many of these trends will persist even after lockdown. More people, including newbies in the kitchen, have found a love for cooking and baking, while homecooked meals have also brought many families closer together. With the increased appreciation towards ‘home projects’, we are expecting more people to cook at home than in pre-COVID times.
Improving e-commerce channels and offline-to-online services will be also important to meet the needs of consumers in the future. F&B retailers will need to up their e-commerce game. While brick and mortar stores will still remain relevant in the post-pandemic world, this period has shown the importance of having a strong e-commerce presence and robust supply chain. Consumers will become more used to shopping for groceries online, especially for products that they cannot typically find in the brick-and-mortar stores. If F&B brands want to extend their reach to a wider audience through e-commerce, the time to do so is now.
Stay ahead
Get regular insights
Keep up to date with the latest insights from our research as well as all our company news in our free monthly newsletter.
Adaptability: the virus has become the catalyst for tech and sales model evolution for F&B retailers
Short term changes
With every crisis, there is opportunity. COVID-19 has accelerated the evolution of the food retail space, and retailers are adapting in order to realign with the shift in purchasing priorities and new lifestyles.
When bubble tea stores were mandated to close during the Circuit Breaker in Singapore, some partnered other restaurants to continue their sales. Some cafes offered coffee subscription plans for the caffeine-deprived, and others introduced ‘Circuit Breaker meals’ to go along with their drinks. Restaurants that were limited by physical space, or located in less accessible areas, are now able to be on a more level playing field with other restaurants, as long as they have presence online and support home deliveries.
For some brands, the pandemic had a positive impact on their business as they discovered new opportunities online. More consumers got to know some establishments through social media and review sites, meaning that these brands are now able to reach more customers than ever before. However, being able to realize these positive outcomes depended on how fast retailers could adapt to the F&B landscape in lockdown. Whilst some partnered with established food delivery apps such as GrabFood or Deliveroo, others drew on their own staff for deliveries and adopted alternative ways of ordering, such as using SMS/WhatsApp, Instagram messages, or their own websites. During lockdown, consumers were more tolerant of the usability of the platform – instead being able to demonstrate that you were adapting quickly to meet consumer needs was more important.
Long term trends
In the long run, restaurants need to reassess the competitive landscape in order to continue to stand out post-pandemic. Every aspect of the typical sales funnel, such as brand awareness, consideration, and trial, would have shifted due to the purchase behavioral changes during the stay home period. Previously unknown brands may have gained popularity as they reached more consumers’ homes. Consumers will also have different assessment standards for restaurants post-COVID, such as hygiene standards. Retailers therefore need to reconsider their USPs to stand out amongst new competitors in the market.
Unfulfilled need: starving for experiences – an area brands can focus on during and post COVID
Short term changes
As the pandemic subsides, will restaurants still retain their delivery model? Yes and no. Less popular food places, and those restricted by physical location or the space required for social distancing may continue to improve their online platforms to expand their reach through deliveries. But, high-end restaurants and cafes may not. While taste is a critical component of the F&B experience, it has to go in hand with the service, the ambience, and even the company while dining in. Psychological research has also shown that the sense of taste plays only a small role in the whole dining experience. It is a multisensorial experience, which can be best presented in the curated setting of a restaurant, with its choice of plating, lighting, background music, and interior design.
Even though there are do-it-yourself packs for bubble tea or cocktails, for most the ambience of eating or drinking out is unbeatable, so F&B retailers will need to consider how they deliver the experiential aspect, whilst social distancing continues, in order to differentiate from other brands.
Medium to long term trends
Post pandemic, consumers who have been starved of in-restaurant F&B experiences will be hungry for these – and may not mind paying a premium. How can F&B retailers tap into this need while keeping in mind the greater expectations for hygiene standards?
Against, this backdrop, there’s an opportunity for F&B outlets to increase and monetize service personalization. Having more attentive service, customizable menus and dishes, or even food that can ‘interact’ with the diner – basically things that cannot be recreated at home – can be considered by F&B retailers.
 Senior Marketing Executive
 Sales & Marketing